Cosmos DB – Monitoring performance

Cosmos DB has become my latest focus and I hope to start sharing more about ways you can use it. Cosmos DB doesn’t provide the same granularity of query plans as you can get in SQL Server, but it actually does provide some super useful data in the Portal and in Log Analytics.

The first thing to know about Cosmos DB is that everything is measured in Request Units (RU). RUs are a measure of CPU, memory, and disk to perform the operation and return the document. Please especially make note of the second part of that. If you return a lot of documents or exceptionally large documents, your RU charges will be high.

Queries, reads, inserts, updates, and deletes can all be measured by the RUs necessary to complete the action. This means that you want to keep track of the Request Charge value in our queries. The other metric that’s important to track is the Server-Side Latency. There should usually be a correlation between RU charge and Server-Side Latency of the request.

What’s next?

Now that you know the basics of a request charge, we need to get into Metrics and Diagnostic Settings. The default aggregation is usually Average or Sum but I like to start by measuring the Max of Total Request Units in the Metrics tab. Then add in splitting by the Operation Type and filter or split by the Collection and Database. Combining these metrics will give you a great idea of the largest requests sent to Cosmos DB and what type.

Once we have that view, we’re looking for any exceptional activities. Things like a 10,000 RU Query or a 5,000 RU Upsert would certainly be worth investigating. Once you have an idea of where to look by using these Metrics, we will really need Diagnostic Settings. There’s a charge to collecting Diagnostic Settings and they have to be enabled (before the issue occurred so you have data on that issue), but once you have that data, you’re in a great position to start analyzing any issues.

If you’re using the NoSQL API, start by using the the example queries on this page. Just remember that when you include CDBQueryRuntimeStatistics, you will be limited to just queries and not inserts/writes/upserts/etc. To get that data, only use CDBDataPlaneRequests.

For further reading:
https://devblogs.microsoft.com/cosmosdb/cost-optimized-metrics-through-log-analytics/

Hope this was useful! In a future post, I’d like to dive deeper into how you can performance tune a high RU request. Stay tuned!

Presentation 5: Presenting Performance Tuning with Memory Grants

So it’s about a week after SQL Saturday Chicago 2019. The event was amazing, tons of great people and in a great venue. Here’s the details of what happened between Presentation 4 and SQL Saturday Chicago.

Final steps to prepare

Between the last post, presentation 4, and that day, I refined a lot of the presentation. Then I presented it to my team. They were very supportive, which was comforting. I also learned what parts I would need to practice.

While practicing on Friday evening, I found that my system would freeze when I ran my resource semaphore demo. Uh oh. There wasn’t enough time for me to completely debug the demo, although I could see that when it happened, my computer’s hard drive was at 100%.

Rushed for time

Resource semaphore waits are really important for my memory grant presentation. They’re the big problem that’s caused by excessive memory grants, and I wanted to at least show what it looked like. However, with only a few hours remaining, I had to find an alternate solution.

I decided to capture a screenshot during the issues, as a way to prove that the issue was occurring. Even if my system wouldn’t respond, I could show the screenshot.

Here’s that screenshot:

SQL Saturday Chicago and my presentation

Then, on Saturday 3/23, I presented in front of a full room. I was really happy to have so many attendees, and the room had a lot of questions.

And, as expected I needed to use the screenshot. Not good! But it’s better than nothing, and I could show in my later demos that the queries would run with the improvements I suggested.

Overall thoughts

The presentation itself was a success, despite the demo issue. I have time now to do some troubleshooting on my laptop, and I have the screenshots for the next time I present.


Writing a presentation 4: Practice and improvement

My presentation so far is really rough. I need to improve a lot before SQL Saturday Chicago! For now, the goals are to practice the presentation and write the demos.

Practice, practice, practice

I’ve started to talk through what I have done with the slides. This way, I’m used to talking about the topics that will come up on the slides. I’m also practicing what I can remember during my commute.

Writing a demo that needs a memory grant

I need to write at least one really good demo. I hope I can write a few more demos, but I needed a solid yet simple demo that could be used multiple times.

I also wanted to highlight a possible real world scenario. This is what I came up with:

SELECT TOP 500 Title
FROM Posts AS p
WHERE PostTypeId = 1
ORDER BY CreationDate DESC

This is a query on the Stack Overflow database, on the Posts table. PostTypeId = 1 is Posts, and I’m sorting by CreationDate to find the most recent Posts. To me, this is a realistic scenario since I often find applications that want to show users the most recent activity.

Assuming there’s either no indexes here or inadequate indexes, this sort will request a memory grant.

More on that tomorrow! I’ll show the execution plan and how I’ll use this demo tomorrow. Stay tuned.

Writing a presentation 3: Entering the PowerPoint world

This is a series I’m writing as I prepare for SQL Saturday Chicago 2019. My session is called Performance tuning with SQL Server memory grants.

In my last post, I laid out three ideas for the flow

Now it’s time to pick. I’ll move the ideas from post 1 into slides, then I’ll write the final wrap-up slide. Each idea will get its own slide, then I’ll work on developing some content on the slides that come to mind.

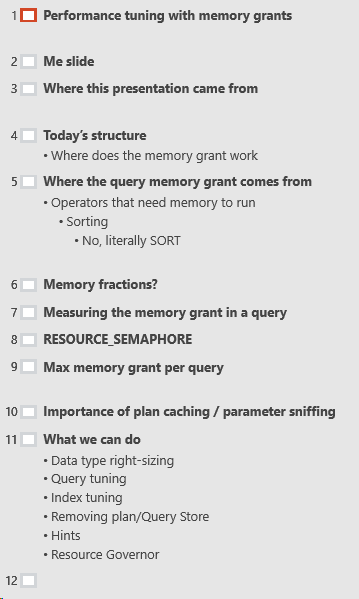
The idea I liked the most was idea #3. I’ve decided to introduce the idea of memory grants by talking about their most common operator, the Sort.

Then, I’ll describe how to monitor the memory grants in an execution plan, demonstrate the issues when memory grants conflict, and show ways to performance tune those pains away.

Let’s take a look at what this looks like:

Next steps

So I’ve got the general flow laid out here in the outline but I don’t have clear thoughts on what I want to say for each section, and I don’t have any demos yet.

The next step for me is to flesh out the ideas with some thoughts on each slide, then identify which concepts are best displayed in demos, creating those demos or borrowing them from previous blog posts.

I might add more slides between completing these steps, it just depends on what the presentation needs.

Stay tuned!

One week blogging hiatus

I’m taking a brief break from daily blogging, even though it has been a ton of fun.

No excuses

I hope my blog has been enjoyable to read. I’ve learned a lot of things so far, it really has been a great few months of blogging.

Daily work stress and the amount of hours I’ve put in over the last week and this weekend have left me exhausted. I love what I do, but the extra commitment of writing a daily blog post(s) over a weekend or after work is currently too much.

Thank you to everyone who reads my blog, and thanks especially to the people who have left comments, shared my posts, and complimented my posts to me. It means so much to me to get feedback.

Where I’m going from here

There are no other planned posts this week while I recover from a very long week. That said, I want to continue two blog series I’ve been working on, the memory grants and the presentation I’m writing. There may be posts on those two subjects this week or next week!

I feel like I’ve only scratched the surface of query memory grants and I love the idea of passing along what I’ve been learning. I also really like sharing my presentation, even when it’s very early and the information isn’t clear.

Anyway, thanks for staying tuned! I’ll be re-focusing next weekend and come back to blogging after a short break.

Favorite community scripts and their parameters

Here’s some of my favorite community scripts and how I like to run them. If you haven’t tried the optional parameters on your favorite scripts, there’s definitely some cool features to try.

sp_WhoIsActive

Written by Adam Machanic and hosted at whoisactive.com

This script is great for all kinds of performance troubleshooting. Here’s the parameter I add on: @get_plans = 1

This will slow the procedure down a bit, but it can be super useful in finding the execution plans of currently running queries. Here’s a quick before and after.

sp_WhoIsActive;
sp_WhoIsActive @get_plans = 1;

Awesome! Now we have the query plan. It won’t contain actual row count or actual executions, although I’d stay tuned for SQL Server 2019 and see what happens for live query executions.

sp_BlitzCache

It’s no secret that I’m a big fan of the First Responder Kit from Brent Ozar Unlimited, but this procedure in particular is amazing.

When you run sp_BlitzCache with no parameters, you get the top 10 plans from cache along with some information on your plan cache’s health. Add one of my two favorite parameters for more specific searching.

sp_BlitzCache @MinimumExecutionCount = 100;

Minimum execution count will only analyze queries with your number or greater executions. That’s great for troubleshooting systems with high batch requests per second, because you can exclude expensive queries that only run once or twice a day. Pick the right number based on your system.

sp_BlitzCache @OnlyQueryHashes = ''

I’m a big fan of using the query hash to identify and track problematic queries. Check out my post for why I like it so much. If you have one or more query hashes that you want to track, you can list them here in a comma separated list.

Let me know if you have other favorite procedures or parameters! Stay tuned.

Writing my presentation 2: Designing the presentation

This series is about my process for writing my upcoming presentation at SQL Saturday Chicago #825.

Today’s goals

Today I’m going to post some of the ideas for the flow of the presentation. These will be general ideas, based on the abstract.

By the time I’m done with this presentation, these could be completely different.

Idea #1: Start with the pain that memory grants can cause RESOURCE_SEMAPHORE

It can be terrifying to feel like you don’t know what to do, and that fear only gets worse when you’re facing an unknown performance issue.

When your system is facing too many big memory grants, a number of troubleshooting scripts won’t work. I feel like this could be catchy and interesting, but it’s risky. If I don’t have the right demo, and if I don’t pull it off right, I could miss the point.

Idea #2: Start in familiar territory, with a normal execution plan and develop from there

In my prerequisites, I mentioned a basic knowledge of execution plans. That can mean a lot of things to different people, but as long as they are familiar with a few operators, I could work my way from there into requested and grant query memory.

This has a lot of potential because it introduces my subject and then I can work into situations where you’d want to tune a query to reduce its memory grant.

Idea #3: Pick a few execution plan operators that request memory

I don’t want to spend the whole session discussing execution plan operators, but I think I could start with the Sort operator. I think people are familiar with explicit sorting, using ORDER BY.

My fear here is that I want to focus on the impact on the whole SQL Server, and spending too much time on operators could burn a lot of session time.

Tomorrow and the weekend

I’m going to leave these ideas here and let them digest overnight. I’m planning to do some research and testing this weekend, which should help me pick (or add more ideas).

What do you think? Am I missing something? Let me know!

Stay tuned!

Writing my presentation part 1: The brainstorm/dump

For this session, I’m relying on a mixture of previous blog posts and new material/demos that I’ll have to write. I’ve written three full presentations, and I usually follow the same pattern.

My method for developing a presentation

First, I write down all my ideas. Then I sort through them to tell a coherent story, and find what demos I need to write. Finally, I polish and polish, to get to a point where I’m happy with the presentation. This is not the final copy.

The final copy is created after I practice the presentation and demos until they’re second-nature. That is the most time-consuming part by far, but it gives me confidence when presenting.

My current list of ideas

The session title is Performance Tuning with SQL Server Memory Grants. This has a big influence on what ideas I want to show.

Here’s the list, in no particular order:

  • Include the information on the max size of a memory grant from this blog post
  • Demonstrate problems with big memory grants, specifically RESOURCE_SEMAPHORE waits
  • What does a memory grant do
  • Why is a memory grant requested
  • How do data types and sizes affect the memory grant
  • Consider including information on the “excessive memory grant” warning in execution plans
  • PerfMon counter: Memory Grants Pending
  • Resource governor
  • Currently running queries
  • Small/large semaphores
  • Memory grant hints
  • What operators in execution plans use memory grants
  • Minimum size of a memory grant

Next step

The next step is to work on connecting the ideas to form a story through the presentation. It’s likely that I’ll have to trim that list down, and there’s probably ideas I’ve forgotten.

Please feel free to give feedback as I work on this presentation. Stay tuned!


Writing a new session/Preparing for SQL Saturday Chicago

So, I’m presenting a session at SQL Saturday Chicago on March 23, 2019. This is a new session, called Performance tuning with SQL Server memory grants.

Blogging about writing a presentation

I’m going to write a couple blog posts as I write this session and practice for it. I hope this is interesting to read.

Tomorrow, I’ll brain dump all my ideas into a blog post.

Here’s the session abstract

When you’re performance tuning queries with memory grants, you want to know where, how and why the memory is granted and used in your query.

In this session, we’ll talk about analyzing requested and granted memory inside execution plans, the plan cache, and in currently running queries.

We’ll also talk about troubleshooting your system when many queries have memory grants.

Prerequisites: General knowledge of execution plans and query writing

Stay tuned!

CTRL + F in SSMS execution plans

I just discovered this the other day and I had to share it.

First, we need a query in Management Studio

USE StackOverflow2010
GO

SELECT *
FROM Posts as p
JOIN Users as u on u.Id = p.LastEditorUserId
WHERE u.Id = 1

Okay, now I’ll get the execution plan. It looks like this:

Good? Maybe.

Now, click on the execution plan and use the keyboard shortcut, CTRL+F

This menu should come up.

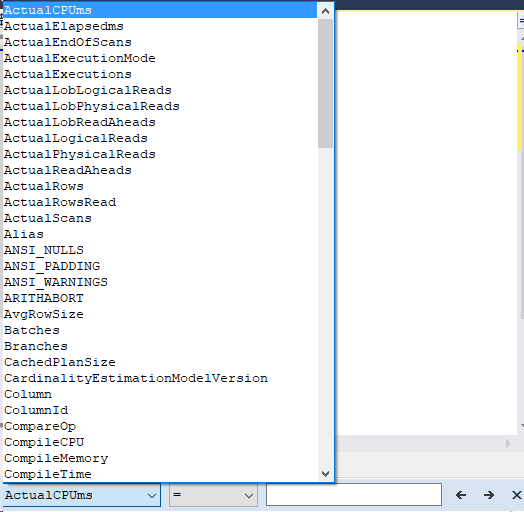
If we open the ActualCPUms window, we get even more options.

And now for a demo using it:

Let’s say we want to find all the operators that used the Posts table. Simply use Contains Posts, and use the arrows to go through the operators. See the video demo below.

I recommend opening it in full screen:

By continuing to use the site, you agree to the use of cookies. more information

The cookie settings on this website are set to "allow cookies" to give you the best browsing experience possible. If you continue to use this website without changing your cookie settings or you click "Accept" below then you are consenting to this.

Close