My alternative to sp_WhoIsActive

I use sp_WhoIsActive a lot. I’m extremely grateful for Adam Machanic writing it. It has tons of options that let you specify exactly the information that you need for troubleshooting.

So why did I write a different query to get activity?

There’s some systems where sp_WhoIsActive is too slow. It could be resource related, like CPU, memory, or TempDB pressure, or it could be the DMVs. I’ll talk about that later, I wanted to introduce the idea that there’s situations where you can’t use sp_WhoIsActive.

In that kind of system, you need a lightweight query that can still get the SQL text that the users submitted, along with some similar metrics that you’re used to seeing.

Just three DMVs for this query

I’m just using dm_exec_requests, dm_exec_sessions and dm_exec_input_buffer.

SELECT s.session_id, 
	r.start_time, 
	s.host_name, 
	s.login_name,
	i.event_info,
	r.status,
	s.program_name,
	r.writes,
	r.reads,
	r.logical_reads,
	r.blocking_session_id,
	r.wait_type,
	r.wait_time,
	r.wait_resource
FROM sys.dm_exec_requests as r
JOIN sys.dm_exec_sessions as s
	 on s.session_id = r.session_id
CROSS APPLY sys.dm_exec_input_buffer(s.session_id, r.request_id) as i
WHERE s.session_id != @@SPID
and s.is_user_process = 1 
--Remove the line above if you want to see system processes

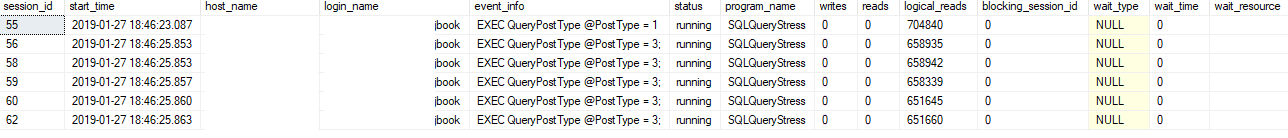
Now, I want to show you a side-by-side comparison of the results. The result sets are very similar, on purpose because I tried to get the same information from dm_exec_requests and dm_exec_sessions.

I’m running a workload using SQLQueryStress, another tool from Adam Machanic. Please click the image to view the full image, they’re huge screenshots.

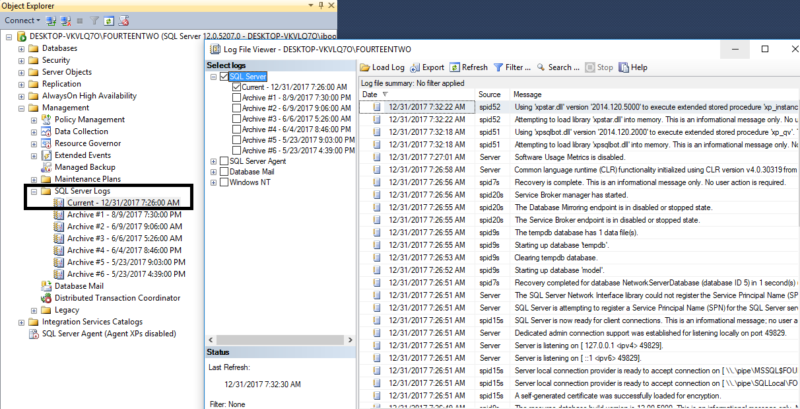
First, the results from sp_WhoIsActive.

Partial column list of sp_WhoIsActive, there’s more columns available

Now the results from my query.

My query, current activity.

Pros and Cons of each query

Let me the first one to say: sp_WhoIsActive is better. For 99.9% of servers, you want to use sp_WhoIsActive. It’s more user-friendly, it’s more accurate, and it has many more DMVs used to gather information.

There’s also the matter of the sql_text vs event_info. In sp_WhoIsActive, you’re seeing the exact snippet of sql text that’s currently running. This is awesome, and much better.

However, I noticed that some of my SQL Servers would take a really long time to access the DMVs for sql text. To reduce that overhead, my query uses event_info, which will include information like “@PostType = 3” which is the literal and entire text that the user submitted to SQL Server.

If you find my query useful

If this post is useful to you, please let me know. I’m very open to suggestions and ideas on how to improve my version!


SQL 101: Two places to start troubleshooting

Getting started

Someone calls you at 1 AM on Saturday and says, “Is there an issue with SQL?” First, breath and take a look at your logs. This post is about two places you can take a look to see if there’s an issue, quick, so you can get back to sleep. Especially when I was new to SQL Server, I thought fixing an issue would involve querying the server to see what was there. However, both of these locations are available through the GUI and are easy to get to. The two places I’d start looking are the Windows Server Application Log, and the SQL Server Log.

What to look for

In both of these locations, look for the last date time when you knew SQL was working. Then look messages about errors from SQL in between then and now.

1: Windows Server Application Log

My favorite way to read this log is with the app Event Viewer. You can search for this app in Windows or you can go to the file directory: C:\ProgramData\Microsoft\Windows\Start Menu\Programs\Administrative Tools

Start up this app. By default, it shows the logs of your local computer. To connect remotely, go to the top left of the app, click Action -> Connect to another computer

Once you’ve got the app running, go to Windows Logs and click on Application. It’s as easy as that. If you have multiple SQL Server instances running on the same server, you can look at the “Source” column to see what instance wrote to the log.

Here’s what you should see:

2: SQL Server Error Log

Another useful log. To find this one, you can go to the file location listed in the screenshot above. That’s for my local instance, yours will be slightly different since my instance is named “FOURTEENTWO” (SQL Server 2014, instance #2 on this server).

Or

You can open SQL Server Management Studio (SSMS). Connect to your server, in Object Explorer go to Management -> SQL Server Logs

Guaranteed?

No. I can’t guarantee that this will help you fix your issue. But I always forget it! It’s saved me a lot. Here’s a list of things that are logged in these locations, that I’ve needed to find:

  • When SQL Server started
  • When SQL Server crashed and where the log dump is stored from that crash
  • Changes in compatibility level of databases


By continuing to use the site, you agree to the use of cookies. more information

The cookie settings on this website are set to "allow cookies" to give you the best browsing experience possible. If you continue to use this website without changing your cookie settings or you click "Accept" below then you are consenting to this.

Close