Combining a few themes of recent posts today. I’ll mix in some sp_executesql, it’s always parameter sniffing, and the plan cache.
Consider this situation
We converted an ad-hoc query into a prepared query using sp_executesql. Then, a user called in reporting slowness. When we run the query in Management Studio, the query runs quickly. We checked our SET options with the application and they’re matching.
What could be causing the difference?
Well, it could be the line endings in our version of the query. If the query we’re running in Management Studio has different text or line endings, we might not be retrieving the right query from cache to correctly reproduce the parameter sniffing issues.
First, the query in cache
Let’s take a look at the query that’s causing issues in the plan cache.
USE StackOverflow2010
GO
EXEC sp_executesql N'
SELECT p.Body,p.Tags
FROM Posts as p
WHERE p.PostTypeId = @PostType',
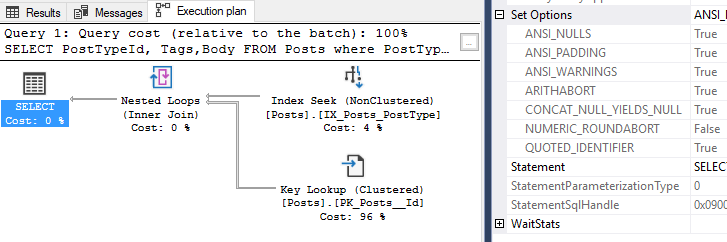
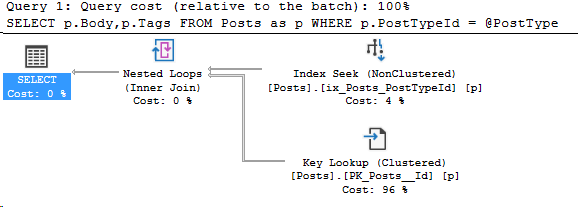
N'@PostType INT', '1'Here’s the execution plan for that query:
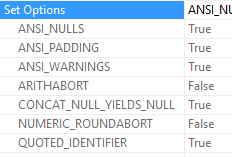
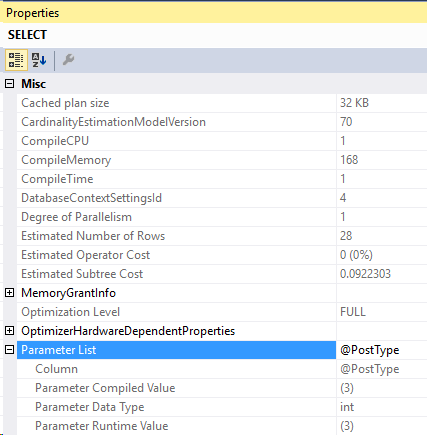
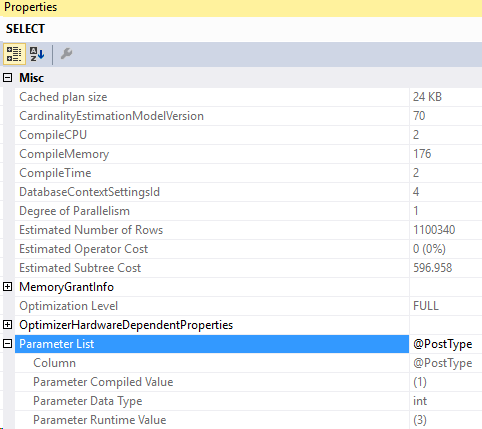
And the compiled parameters:
Second, the query we’re running locally
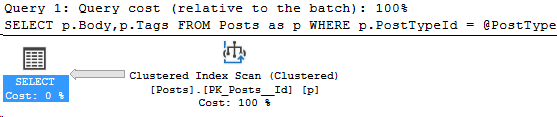
When we run our query locally, we get a different plan. We are using a different parameter, but that’s not the critical difference. The difference in this query is the spacing.
USE StackOverflow2010
GO
EXEC sp_executesql N'
SELECT p.Body,p.Tags
FROM Posts as p WHERE p.PostTypeId = @PostType',
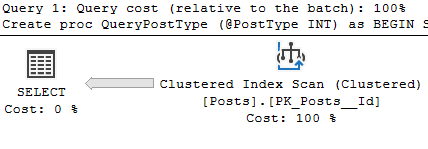
N'@PostType INT', '3'I specifically changed the spacing on line 6-7 to show that now I’m getting a different plan. Here’s the new plan I get:
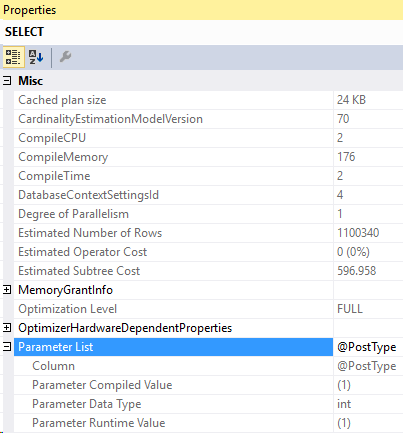
And the new compiled parameters:
So how do we find the correct formatting, so we can retrieve the compiled plan from the first query?
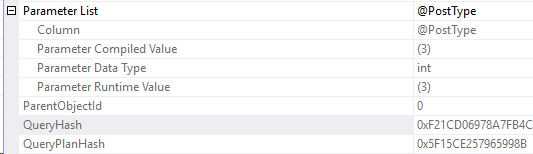
Well, our first step is to go check the plan cache to see if we have the right query hash, and sql handle. Use the second execution plan’s properties to find those values.
They’re right below the parameter list:
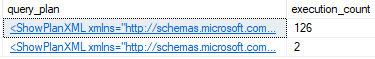
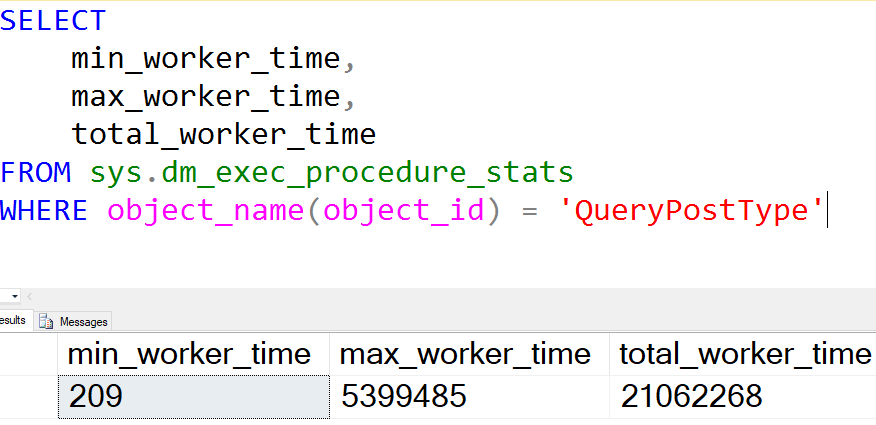
Now, we query the plan cache for that query hash and use the DMV, sys.dm_exec_sql_text.
SELECT execution_count,max_worker_time,sText.text
FROM sys.dm_exec_query_stats as s
CROSS APPLY sys.dm_exec_sql_text(s.sql_handle) as sText
WHERE s.query_hash = 0xF21CD06978A7FB4C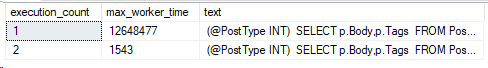
One of these is the problematic query, that’s for sure!
Side note: Turning on CR/LF
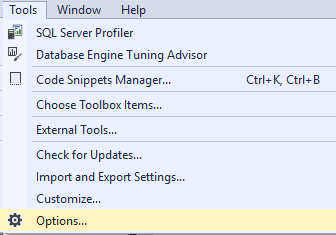
Now, for this next step, you’ll need to setup your Management Studio to retain CR/LF (Carriage Return and Line Feed). Find that option under Tools->Options
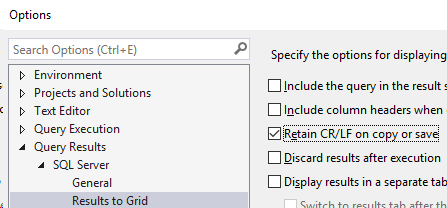
Then under Results to Grid, check this box for Retain CR/LF. Once you do this, you’ll need to open a new tab or restart your Management Studio for it to take effect.
Back to the plan cache
Let’s copy the text out from this query result. I copied both results into new windows, here’s a side-by-side.

Now, I mentioned earlier changing this specifically. But if I saw this while troubleshooting parameter sniffing, this would be a big sign that the two queries had different formatting.
If we have access to the application codebase, we can ask for the full query with formatting included. Otherwise, this crude but effective comparison showed us that we need to change formatting.
Applying the change and demonstrating the query slow in Management Studio
Here’s our PostType 3 query with the correct formatting.
USE StackOverflow2010
GO

EXEC sp_executesql N'
SELECT p.Body,p.Tags
FROM Posts as p
WHERE p.PostTypeId = @PostType',
N'@PostType INT', '3'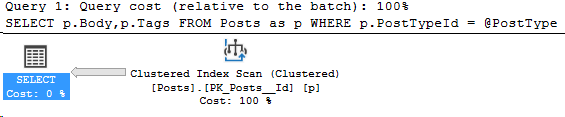
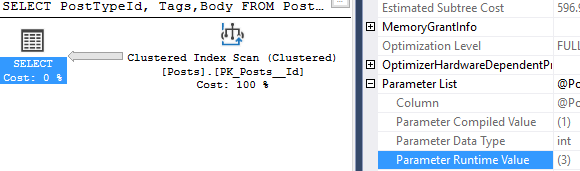
And this time, the compiled value is 1 but the actual runtime parameter is 3. We retrieved the bad plan from cache!
After thoughts
This example is extremely straightforward. I didn’t add any special formatting or white space beyond an extra line. Issues like this can get much more complicated, quickly.
When troubleshooting parameter sniffing issues, having the query version from the application is going to be better than trying to reverse engineer it from the plan cache like this example.
However, the plan cache can be used to determine if there’s a difference, when combined with comparison tools like Notepad++‘s Compare functionality. There’s definitely room for another blog post on that.
I wanted to write this post to show that small differences in text can make the difference when it comes to reproducing a parameter sniffing issue.
Stay tuned!