At first, this statement might sound a bit confusing. Usually, we expect wait statistics to show us what a query is waiting on, whether it’s waiting on memory, loading pages from disk, or any of the other numerous wait types.
Once you start collecting wait statistics, you’ll have a lot of data to sort through. You might find waits like CX_PACKET, CX_CONSUMER, and PAGEIOLATCH. Surprisingly, these could mean that your databases aren’t well indexed.
Let’s take a look at an example in StackOverflow2010
For the sake of this post, pretend that this query is mission critical, and we need to diagnose why it’s running slow and fix it by any means possible.
SELECT p.Score, p.CommentCount
FROM Posts as p
WHERE p.LastEditorDisplayName ='arthurd'
--0 rows returned, took 38 seconds
Here’s the actual execution plan.
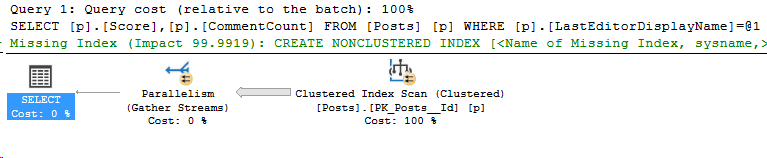
For now, let’s ignore the missing index request. Missing indexes are unreliable. Let’s start by using sp_WhoIsActive while the query runs, and see what it says.

Hmm, it shows the wait type of CX_CONSUMER. This is a parallelism wait, let’s try the query again with OPTION (MAXDOP 1).
Trying the query with no parallelism
SELECT p.Score, p.CommentCount
FROM Posts as p
WHERE p.LastEditorDisplayName ='arthurd'
OPTION (MAXDOP 1)
--0 rows returned, 1 minute 30 seconds duration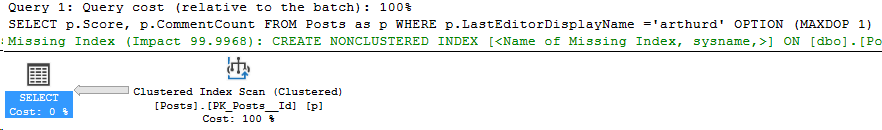
Here’s another capture of sp_WhoIsActive, this time with only one core so there’s no parallelism.

Oh now we have another wait. This time, it’s PAGEIOLATCH_SH. That’s an IO wait, SQL Server is having to retrieve the data pages from disk. But wait, we haven’t even considered that we could index this problem.
Finding a solution without calling the SAN admin
Check the indexes on the table with your favorite script. I’ll pick sp_BlitzIndex
exec sp_blitzindex @DatabaseName = 'StackOverflow2010',
 @SchemaName = 'dbo', @TableName = 'Posts'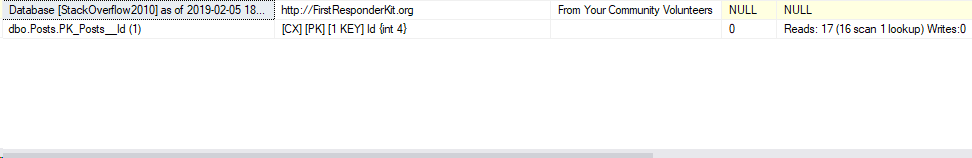
So there’s no nonclustered indexes on this table. The top index, PK_Posts_Id is the clustered index and it’s being scanned each time. Let’s create a covering index for our mission critical query.
CREATE NONCLUSTERED INDEX ix_LastEditorDisplayName
ON Posts(LastEditorDisplayName)
INCLUDE (Score, CommentCount)
And now we re-run our query, no MAXDOP hint.
set statistics time on;
SELECT p.Score, p.CommentCount
FROM Posts as p
WHERE p.LastEditorDisplayName ='arthurd'
--7 milliseconds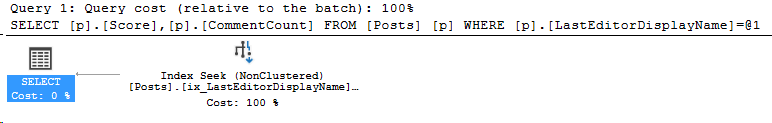
Now the query runs quickly! No wait statistics to be found.
Moral of the post
I don’t want people who read this post to think that I’m a proponent of creating indexes for every single slow query. I also don’t want to leave the impression that wait statistics always mean there’s issues with queries.
However, in some cases, the wait statistics can be a symptom of broader issues with poorly written queries, lack of indexing strategy, and other performance problems. I still recommend starting with wait statistics, then work your way through your environment to see if the database is designed properly and tuned.
Stay tuned!