SQL Server 2008 is reaching end of support this year, so upgrading your SQL Server might be on your mind. One of the big changes when you upgrade your SQL Servers is upgrading the compatibility level, which by default will upgrade the cardinality estimator (CE).
This can change query performance, for better or for worse. This post won’t focus on whether it’s good or bad, but instead I want to show you how you can check to see what CE was used by your queries.
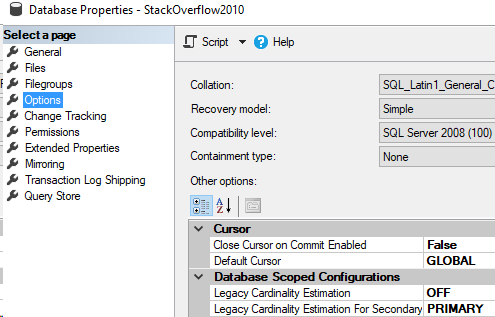
Let’s look at a database in 2008 compatibility level
Here’s our database properties.
This is similar to a database restored fresh from 2008 onto a 2017 server. Now, let’s run our query and see what CE will be used.
USE [StackOverflow2010]
GO
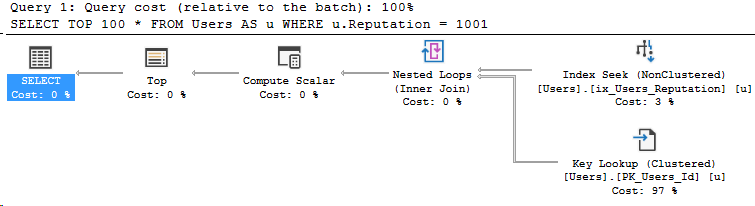
SELECT TOP 100 *
FROM Users AS u
WHERE u.Reputation = 1001
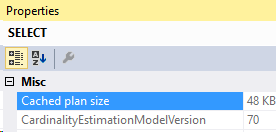
Looking at the properties of the SELECT operator.
So the old cardinality estimator is version 70. Let’s upgrade the compatibility level to SQL Server 2017.
ALTER DATABASE [StackOverflow2010] SET COMPATIBILITY_LEVEL = 140
GO
Re-running our query:
So this query is using the 2017 CE. There’s two more versions available in SQL Server 2017: 120 and 130, which are accessible with compatibility level 120 and 130 respectively.
That brings us a total of four different versions: 70, 120, 130 and 140.
Compatibility level (and therefore, cardinality estimator level) can change your execution plans
I didn’t show any examples in this post because the execution plan stayed the same, but changing the database compatibility level can dramatically change execution plans. That’d be a good topic for a future post!
I think Dynamic Data Masking is pretty cool. The idea is basically to provide a mask for certain users when they might see protected data. The documentation on this feature is actually pretty deep, it’s worth a look.
I just want to show you how you can see the masking in an execution plan. Let’s mask some data in StackOverflow2010! (Also, there’s an interesting side note at the end)
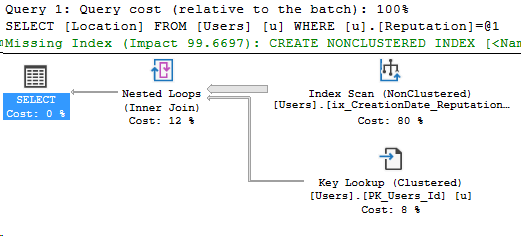
First, what the administrator sees
SELECT Location
FROM Users as u
WHERE u.Reputation = 1001
And of course, the administrator’s execution plan!
Applying the data mask
ALTER TABLE Users
ALTER COLUMN Location
ADD MASKED WITH (FUNCTION = 'default()')
That’s pretty straightforward. As far as I can tell, you can’t define a custom mask. I was going to leave a joke as the mask but oh well!
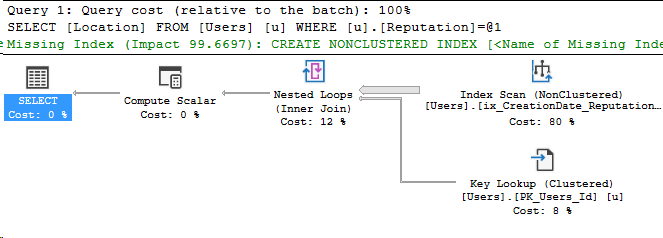
What it looks like to a user (+the data mask execution plan)
Luckily there’s a test script on the information page for Dynamic Data Masking. That makes this part easier. Here’s my slight variation of it.
CREATE USER User1 WITHOUT LOGIN;
GRANT SELECT ON Users TO User1;
GRANT SHOWPLAN  TO User1;
EXECUTE AS USER = 'User1';

SELECT Location
FROM Users as u
WHERE u.Reputation = 1001;
REVERT;
This was actually trickier than I expected. Let’s take a look at the results.
And the main event, the new execution plan:
Reviewing the data mask execution plan
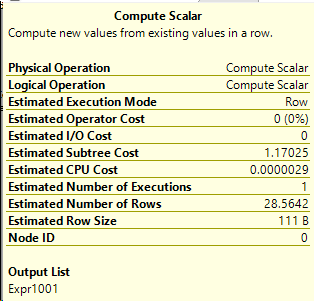
The only difference is that Compute Scalar operator. Let’s take a look at it.
Okay, cool it’s Expr1001. What is that in words we can understand?
[Expr1001] = Scalar Operator(
DataMask([StackOverflow2010].[dbo].[Users].[Location]
as [u].[Location],0x07000000,(1),(0),(0),(0)))
Aha. That’s pretty cool, since this scalar function isn’t applied until the data is being retrieved, that saves it from doing extra work. This also explains why there’s warnings on the documentation about ad hoc queries.
If someone has ad hoc query access and you’re using Dynamic Data Masking, the predicates are still literally applied.
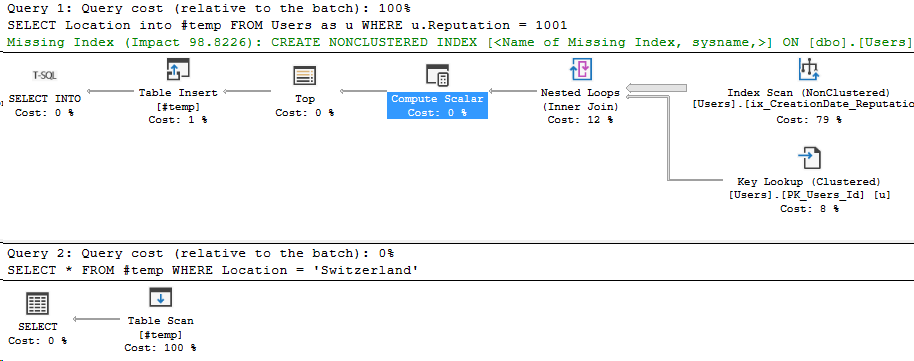
Bonus chapter: What about intermediate results storage, like temp tables?
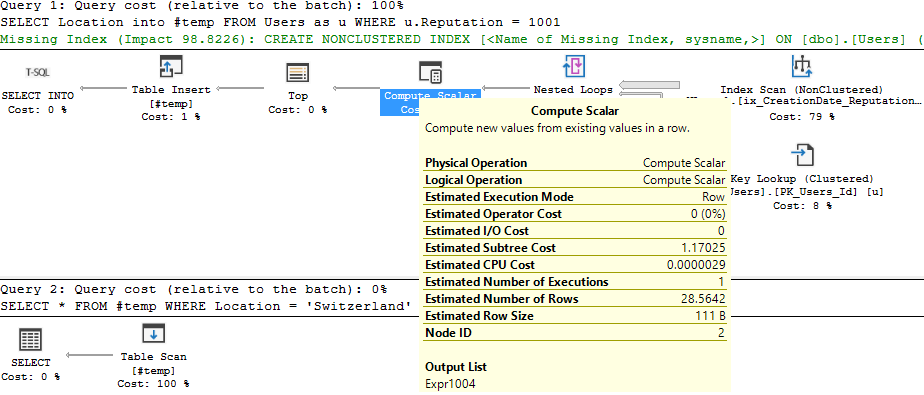
Well, this should be interesting. Let’s load the results of the previous query into a temp table and then filter.
EXECUTE AS USER = 'User1';

SELECT Location
into #temp
FROM Users as u
WHERE u.Reputation = 1001

SELECT * FROM #temp
WHERE Location = 'Switzerland'

DROP TABLE #temp;
REVERT;
Uh oh. I didn’t get any rows back:
Here’s the execution plan, highlighting where the filter was applied:
What if I run the same query as my normal admin account?
I get the same execution plan actually! Even including the Compute Scalar. But this time, my query returns one row.
Well, what do you think? To me, it looks like there could be some oddities when using temp tables with data masking.
Thanks for reading this abnormally long post. I might like execution plans a bit. Stay tuned!
Update (2019/02/08): Originally the index definition on this post was on Users(DisplayName) INCLUDE Age. This was preventing an Index Seek because I wanted to show an Index Scan. I didn’t mention it in the original, but it’s clear to me that I made a mistake. Thank you to Bryan and John in the comments for pointing this out. Given that information I have re-written this post.
This post will cover the IN clause and another way to rewrite the same logic. I don’t intend to say that IN is better or worse than other T-SQL, I just want to showcase what it does.
We’ll jump right into the demos. I’m using StackOverflow2010 for this, and I’m going to create an index to be used by this query.
CREATE NONCLUSTERED INDEX ix_Age_DisplayName on Users (Age)
 INCLUDE (DisplayName)
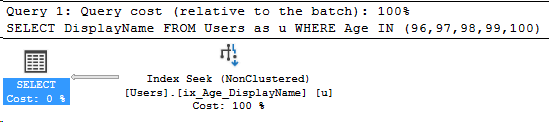
SELECT DisplayName
FROM Users as u
WHERE Age IN (96,97,98,99,100)
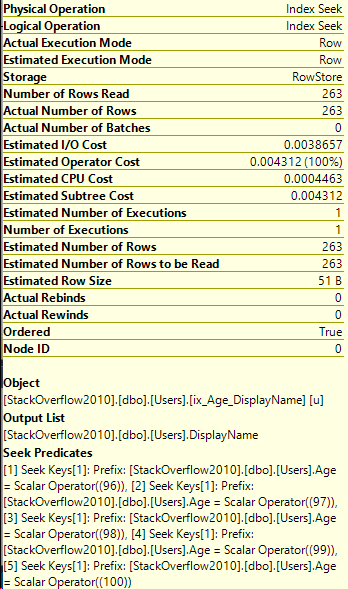
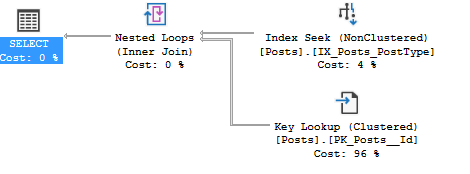
Okay, cool. Let’s take a look at the Index Seek.
I want to focus on the bottom part. SQL Server decided to split our query into a series of Seek Keys.
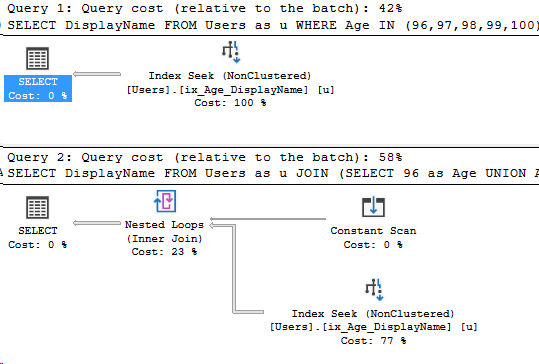
This has interesting implications for how our query was optimized. Let’s take a look at another way of writing the same query.
SELECT DisplayName
FROM Users as u
JOIN (SELECT 96 as Age UNION ALL
SELECT 97 as Age  UNION ALL
SELECT 98 as Age  UNION ALL
SELECT 99 as Age  UNION ALL
SELECT 100 as Age ) as A1 on A1.Age = u.Age
This query will get the same result set. This time, let’s run both queries in the same batch. Ignore the Query Cost, just look at the different execution plans.
This is what query tuning is all about. Rewriting a query in two different ways to see if the optimizer will pick a different execution plan.
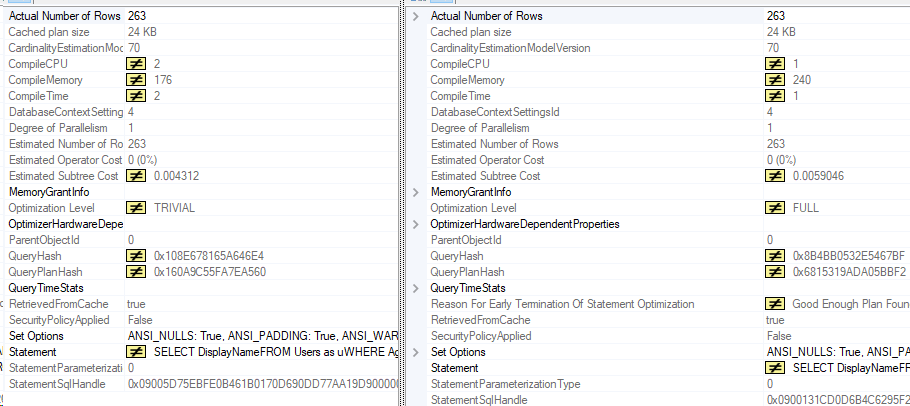
Comparing the IN clause vs the UNION ALL
There’s two significant differences in these plans. Let’s take a look at the execution plans, using the execution plan comparison feature in Management Studio.
Click on the whole comparison if you’re curious. I’ll zoom in on the differences below. The first plan using the IN clause is on the left. The second plan using the UNION ALL is on the right.
One thing to note is the Optimization level is different. The first query using the IN statement only received trivial optimization while the UNION query received full.
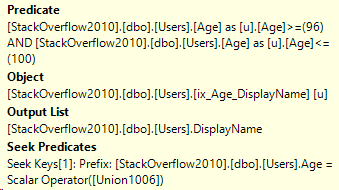
Taking a look at how the predicates were applied
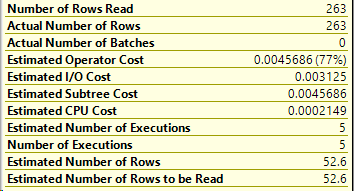
I showed how the Seek Keys were applied above, but here’s the predicates from the Index Seek when using the UNION ALL approach:
And of course, the number of rows read:
Moral of the post
The point of this post is that query tuning can be as simple as re-writing the IN clause. I don’t want to say that either way is better, since it depends on your environment.
Don’t rewrite code unless there’s already a performance issue, and if you do, test it thoroughly.
Did you know that you can compare two execution plans in SQL Server Management?
It’s really cool. I use it a lot, as my first stop to compare performance. Let’s take two execution plans from my series on parameter sniffing.
Demo comparing execution plans
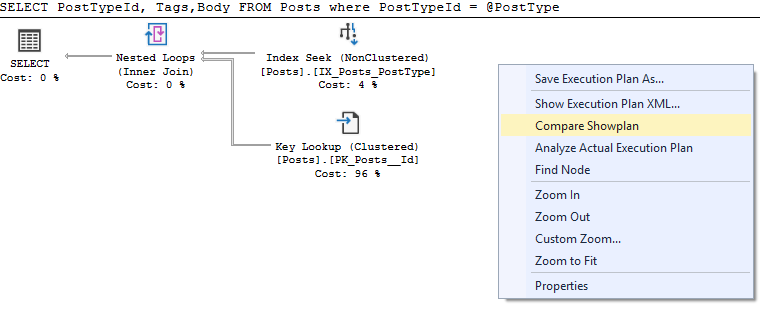
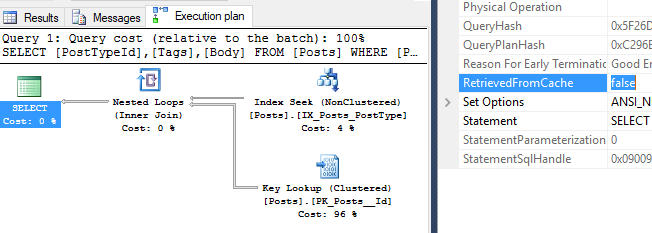
CREATE PROCEDURE [dbo].[QueryPostType] (@PostType INT) as
BEGIN
SELECT PostTypeId, Tags, Body
FROM Posts
WHERE PostTypeId = @PostType
END
GO
exec QueryPostType @PostType = 1
--I cleared the plan cache before running this second test.
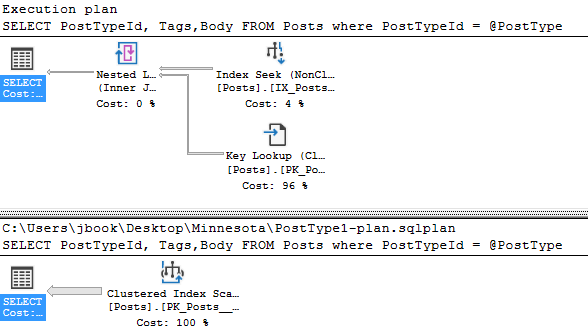
exec QueryPostType @PostType = 3
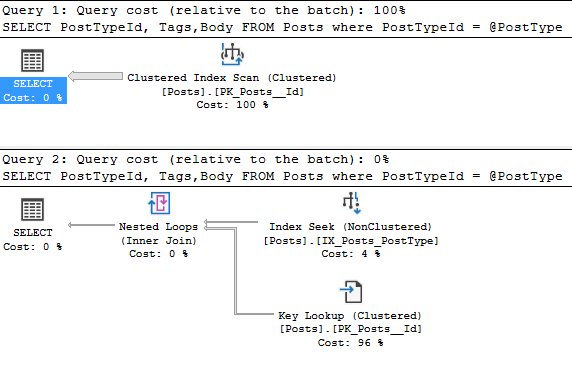
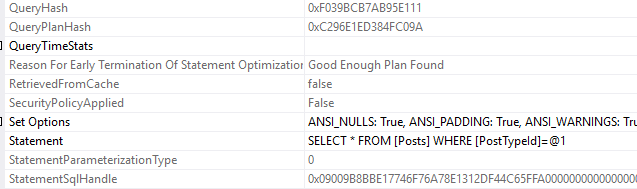
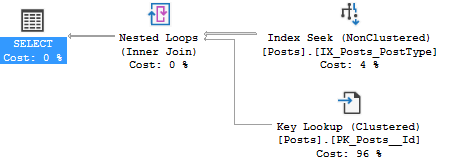
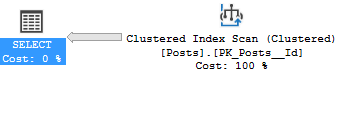
We’re in the StackOverflow 2010 database. The PostType parameter will give us these two execution plans.
In this example, we can see there’s different operators on the Posts table. But in the real world, execution plans are much more complex. That’s where execution plan comparison comes in. Just save one of the execution plans then right-click and pick compare execution plans.
Our first view looks like this, which isn’t super useful.
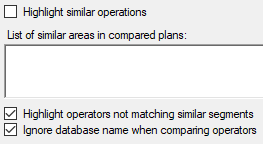
But there’s a better way. First, uncheck the box says “Highlight similar operations” and then check “Highlight operators not matching similar segments”
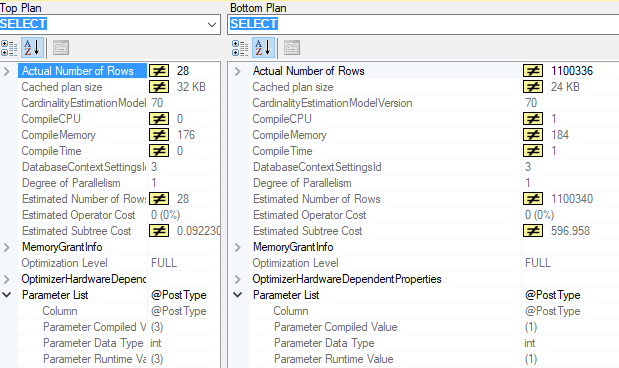
Great! So if we pick the SELECT operators. Take a look at all the differences that are highlighted.
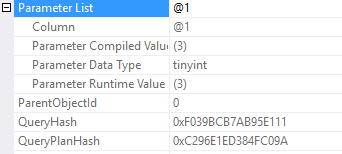
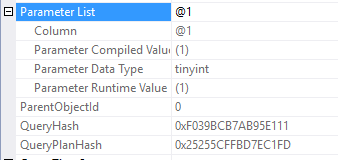
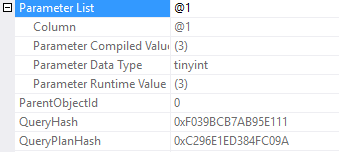
We see in the parameter list that each plan was compiled for a different compiled value. Take a look at the Actual Number of Rows, and all the other differences.
Thanks for reading! I hope this was a useful starting place when you’re comparing execution plans. Stay tuned.
I first came across the value for RetrievedFromCache when I was reading a confusing execution plan. At first, I thought this could be really useful. If this value was true, you could assume that another query had compiled the execution plan that your query used and your query had retrieved that plan from the cache.
What I came to realize is that you can’t trust this value to be correct. Your database settings and type of query will change whether it’s true or not.
Here’s a couple tests that show how unpredictable this value is
I start each test by running DBCC FREEPROCCACHE to clear the plan cache on my test SQL Server. Don’t run this test in prod.
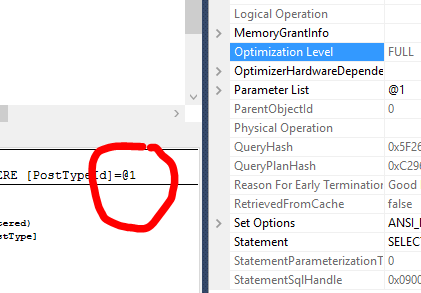
Starting the tests with an ad hoc SQL query.
SELECT PostTypeId, Tags,Body
 FROM Posts where PostTypeId = 3
Okay, this test looks good on the surface. There’s two more things you might be interested in. This query is not considered a trivial execution plan, but it did qualify for simple parameterization. Take a look at the circled parameter here.
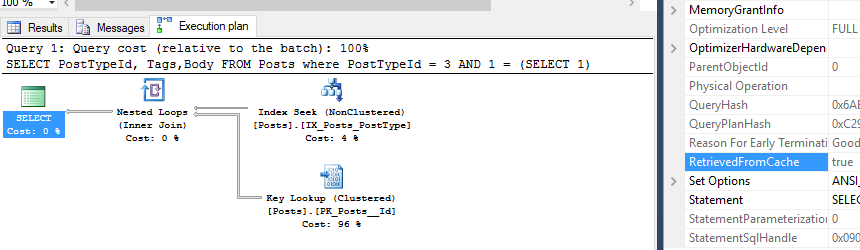
Let’s add some complexity so that the value isn’t parameterized, again clearing the plan cache.
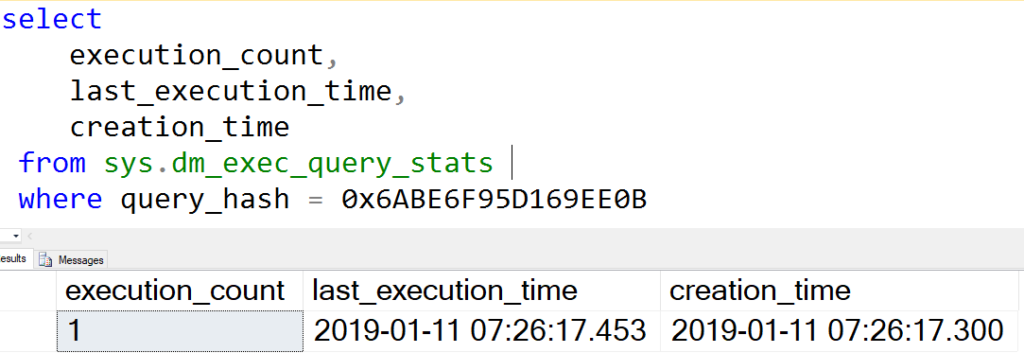
Now I’m just confused. The value 3 wasn’t parameterized, but evidently this query was retrieved from an empty plan cache? Let’s check the plan cache for that query hash and see what it has to say.
Looking into the plan cache
Hmmm. So at the very least, this RetrievedFromCache value is unreliable. If I had to guess, I’d say that this value is true if the plan can be stored in cache, not if it was retrieved. Maybe that’s just a slight typo?
I’d like to dig in more to what this value means but I don’t know where to start. I hope this post helps shed some light on where this value might be coming from.
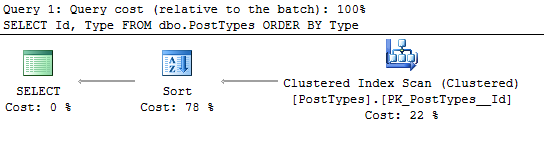
Let’s talk about how queries use memory, specifically in the execution plan. One of the query operators that use memory is sorting. To emphasize this, I’ll write a query with an order by clause, and look at the execution plan.
Query that will request a memory grant
Using StackOverflow2010 (Thanks to Brent Ozar and the Stack Overflow team for their data dump):
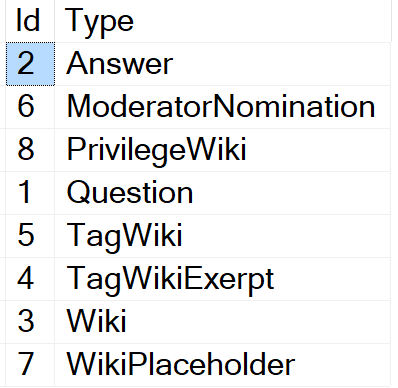
SELECT Id, Type
FROM dbo.PostTypes
ORDER BY Type
Here’s the results if you’re curious.
We want to look at the execution plan.
First, let’s look at the properties of the SELECT operator.
This is the memory grant for the entire query. Since we know that the Sort operator uses memory, let’s take a look at that operator and confirm that it used memory.
Where does the memory grant go?
We can confirm that the sort operator was requesting memory by looking at the operator’s memory fractions.
It gets harder from here. The execution plan is very useful for determining where the memory grants are coming, but once there’s multiple operators requesting memory grants, it gets much more complex.
For example, memory grants can be reused between operators in execution plans (source).
I want to continue this series and talk more about query memory usage. For those posts, please stay tuned!
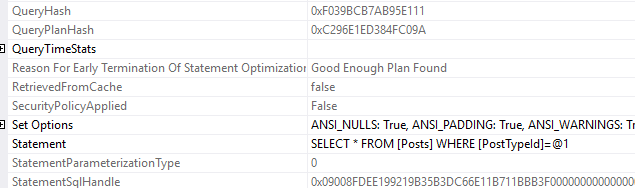
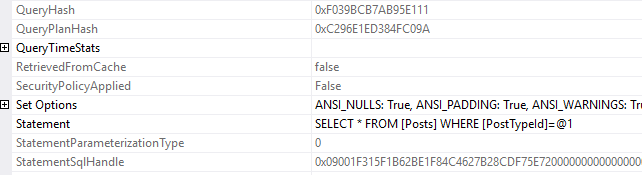
Following up on my post on query_hash, the sql_handle is an attribute that describes the query sent to SQL Server.
While the query_hash ignores parameters and white space, the sql_handle is based on literally every single value passed to the server in the query.
Demo time: creating a sql_handle
I’m re-using the same query from the query_hash example.
--query 1
SELECT *
FROM Posts
WHERE PostTypeId = 3
I want to look at that statement sql handle. In the post I call it the sql_handle because that’s the column name in the DMV sys.dm_exec_query_stats. In this execution plan, it’s called the StatementSqlHandle.
I don’t care about the specific characters, I just want to copy that text so we can compare it when I change the SQL text.
So that’s the interesting part about sql handles. All I did was change the parameter value, and despite having the same query hash, now the query has a new sql handle.
There’s the third, new sql handle. That’s the tricky thing about sql handles, they’re so very specific to the exact query that was passed in.
If you’re searching for ad hoc queries
When you’re querying the plan cache, look for queries with the same query_hash. They might each have their own sql_handle.
Finally, here’s all three sql handles side by side
--I deleted the zeros at the end so it's easier to compare
0x09008FDEE199219B35B3DC66E11B711BBB3F
0x09001F315F1B62BE1F84C4627B28CDF75E72
0x09009B8BBE17746F76A78E1312DF44C65FFA
Thanks for reading! Stay tuned for query plan hash and plan handle, the other descriptors of queries.
Let’s talk about execution plans and query attributes.
Query hash is a way to describe queries that have the same query text, excluding the parameters. I think the best way to show this is examples, so I’ll write some queries and show you the query hashes on my system.
Keep in mind that these queries are ad-hoc
--query 1
SELECT *
FROM Posts
WHERE PostTypeId = 3
--query 2
SELECT *
FROM Posts
WHERE PostTypeId = 1
So what does that show us?
If your SQL statement is the same but the parameters are different, the query hash will be the same. Even if the execution plan is entirely different!
What about white space?
This is an important concept. For the query hash, the white space won’t change the query hash, but it will change the other objects like the sql handle. Let’s take the first query, and shape the text.
--query 1, remix
SELECT*FROM Posts
WHERE
PostTypeId = 3
More details to come
There’s more attributes to the query, like the query plan hash, the sql handle, and the plan handle. I’ll handle those in the next blog posts.
Missing index requests look like Staple’s Easy button. We just want to press it and get faster performance. I’m sorry to report that the missing index in your execution plan might not be the answer. It might also have additional missing index requests that you didn’t know about!
First, we need a query
I’m taking this example directly from my Reading Execution Plans Successfully presentation and I used the AdventureWorks2014 database to run all these tests.
SELECT *
FROM AdventureWorks2014.Production.TransactionHistoryArchive
WHERE TransactionDate = '2011-05-01'
UNION ALL
SELECT *
FROM AdventureWorks2014.Production.TransactionHistoryArchive
WHERE ActualCost IN(50, 25, 30);
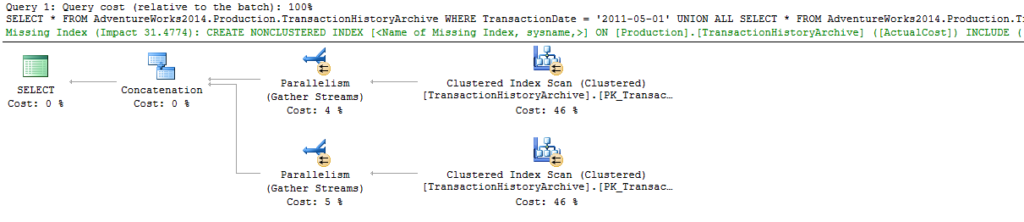
Keep in mind that there’s no index on either ActualCost or TransactionDate, by default in AdventureWorks. Let’s run that query and get the actual execution plan.
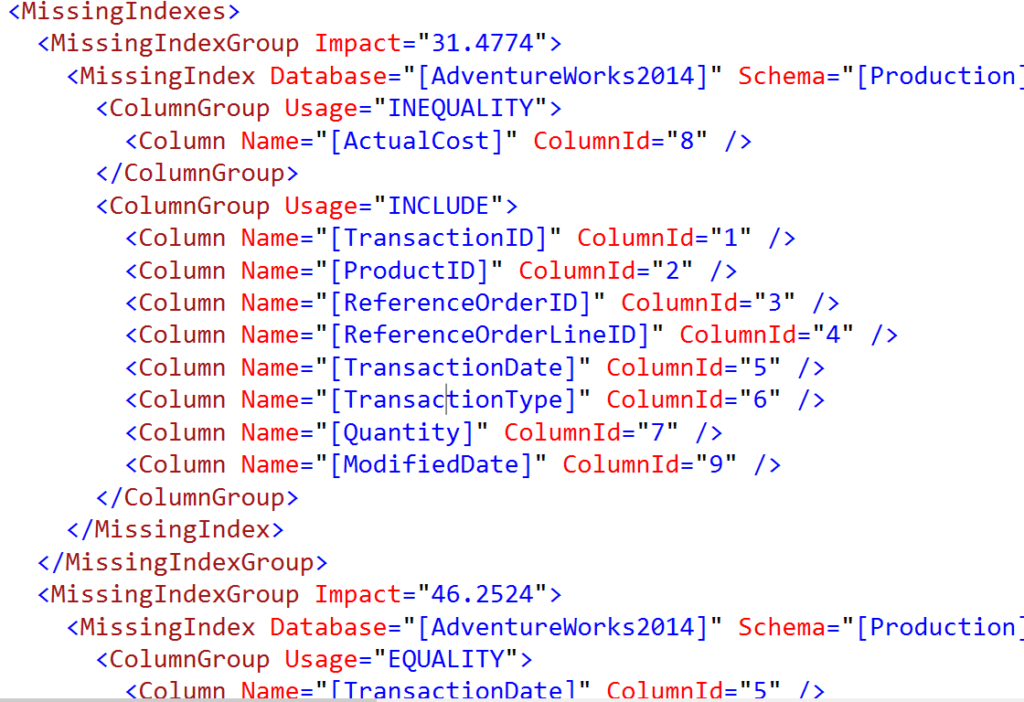
SQL Server is requesting a missing index with an impact of 31, on ActualCost. I’ll refer to this as missing index #1. Here’s the definition of the missing index request.
USE [AdventureWorks2014]
GO
CREATE NONCLUSTERED INDEX [<Name of Missing Index, sysname,>]
ON [Production].[TransactionHistoryArchive] ([ActualCost])
INCLUDE ([TransactionID],[ProductID],[ReferenceOrderID],[ReferenceOrderLineID],[TransactionDate],[TransactionType],[Quantity],[ModifiedDate])
GO
This is missing index request #1, and by default, this is the only missing index we’ll see by looking at the graphical execution plan. There’s actually a missing index request #2, which we can find in the XML (I know, it’s a little ugly to read. Bear with me).
Missing index request #2
That’s a snippet of the XML from the same execution plan. At the top, the 31 cost missing index request is for missing index #1. Right below that, there’s the entire definition of another missing index, request #2.
I find this example interesting because the query starts with a ‘where’ clause on the TransactionDate, and the server estimates the impact of that missing index to be 46, which is higher than 31. Yet when we look in the graphical view, the only request for an index that we can see is request #1, on ActualCost.
What’s the moral of this post?
This is just one of many reasons that missing index requests can be unreliable. I wrote this example specifically to demonstrate that there can be more than one missing index request in a single query.
Stay tuned! More performance posts coming out soon.
Some things in life we ignore. For example, the “check engine” light. That’s just there as a suggestion, right?
But when you’re performance tuning, you can’t afford to ignore the warning signs. I can’t count the number of times that I’ve found the issue with a query by looking at the warnings.
Enough talk, let’s look at an example
Let’s create a table of Students, with just one column.
CREATE TABLE [dbo].[Students]([StudentName] [varchar](100) NULL)
GO
CREATE CLUSTERED INDEX ix_Students_Name
ON Students(StudentName)
GO
I need some dummy data to really increase the numbers here, so I’ll load in the names from StackOverflow2010.
INSERT INTO Students(StudentName)
SELECT DisplayName
FROM StackOverflow2010.dbo.Users
Great! About 300,000 rows were loaded into my new table. Now I need to write a query. How about this query?
SELECT StudentName
FROM Students
WHERE StudentName = N'Arthur'
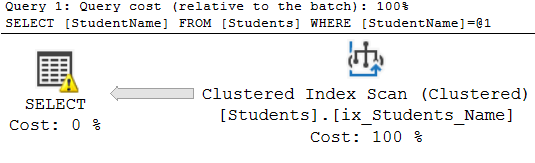
35 rows returned! Disclaimer, none of those users are actually me. This post is about the execution plan, so let’s retrieve the execution plan along with the io statistics by using set statistics io on.
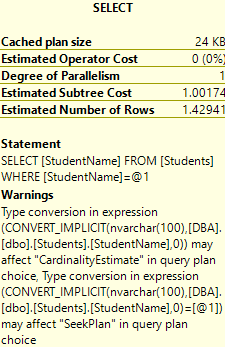
Ah, there’s the warning sign on the left there. Here’s the warning it’s giving us.
Type conversion in expression? What does that mean?
Well, because I used the “N'” prefix around my parameter of Arthur, I was using nvarchar as my data type, and the table’s data type is varchar. When the server received my request, it had to convert the entire column of StudentName into nvarchar before searching the list for the name I sent.
That’s called an Implicit Conversion, and this issue only gets worse as your data grows in size. Often, this issue doesn’t appear overnight. It can exist for weeks or months, just making each query run a little slower. Then in a few years, the query is slow and users start to complain. Since nothing has changed, it’s hard to track down.
Is it worth fixing?
I say absolutely yes. Let’s take a look at this example to see how much it will improve, and then I’ll talk more about the fix in the real world.
SELECT StudentName
FROM Students
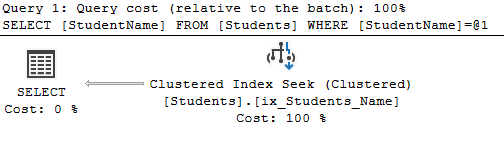
WHERE StudentName = 'Arthur'
Ah, that’s better. Not only has the warning disappeared, but the index scan in the execution plan changed.
What happens in the real world?
The real world is never as easy or simple as a demo environment like this. If your company is international, I’d argue that the correct choice would be to change the data type of the column to nvarchar. That’s a lot harder than the easy fix in my demo.
At this point, when you have a slow query and there’s an implicit conversion that you believe is influencing the execution plan, it’s time to start asking questions. Start by finding your favorite application developer and ask them how they use the column.
More warning sign posts to come
I want to leave an honorable mention for the other warning signs that show up in execution plans, specifically the excessive memory grant warning. I’ll talk about that in the future, stay tuned!
By continuing to use the site, you agree to the use of cookies. more information
The cookie settings on this website are set to "allow cookies" to give you the best browsing experience possible. If you continue to use this website without changing your cookie settings or you click "Accept" below then you are consenting to this.