How many plans are in the plan cache for a stored procedure?

It depends on where you’re looking and how many statements are in the stored procedure.

Let’s take a look at some demos!

First, let’s create a stored procedure with multiple statements

USE StackOverflow2010
GO
CREATE OR ALTER PROCEDURE TestStatements (@Username NVARCHAR(100)) AS
BEGIN

SELECT Reputation FROM Users
WHERE DisplayName  = @Username

SELECT DownVotes FROM Users
WHERE DisplayName  = @Username
END
GO

Great! Now, I’ll execute the procedure.

--Clear your plan cache for this demo
EXEC TestStatements 'Arthur'
GO 10

Perfect. I ran it 10 times to ensure the plan stays in cache for my other demos. Now, my favorite plan cache view is sys dm_exec_query_stats since it has the statistics on usage.

SELECT 
s_text.text,
s.creation_time, 
s.last_execution_time, 
s.execution_count,
s.statement_sql_handle 
FROM sys.dm_exec_query_stats as s
CROSS APPLY sys.dm_exec_sql_text(s.sql_handle) as s_text

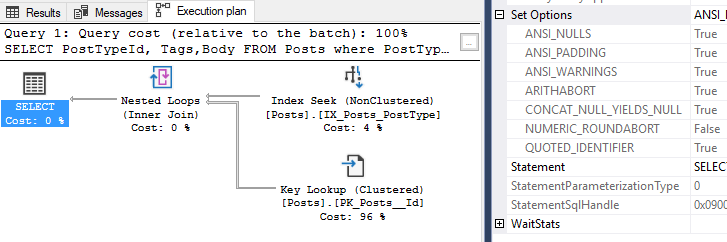
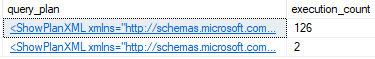
So we have two entries for this stored procedure. I included the statement sql handle to show that each statement handle has its own text. Let’s parse that text to see each statement. I copied the parsing SQL from this Plan Cache article.

SELECT 
SUBSTRING(text, (statement_start_offset/2) + 1,
((CASE statement_end_offset
WHEN -1
THEN DATALENGTH(text) 
ELSE statement_end_offset
END - statement_start_offset)/2) + 1) AS query_text,
s.creation_time, 
s.last_execution_time, 
s.execution_count
FROM sys.dm_exec_query_stats as s
CROSS APPLY sys.dm_exec_sql_text(s.sql_handle) as s_text

So there’s one entry per statement inside sys dm_exec_query_stats. Let’s take a look at another plan cache DMV, dm_exec_cached_plans.

select 
s_text.text, 
s.cacheobjtype, 
s.objtype from sys.dm_exec_cached_plans as s
CROSS APPLY sys.dm_exec_sql_text(s.plan_handle) as s_text

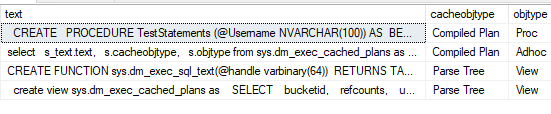
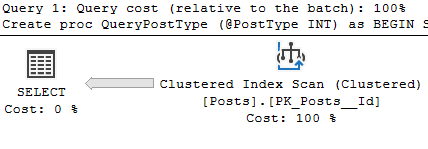
In this view, only the top entry is for the stored procedure. In my opinion, this brings us to a total of three objects in the plan cache for this stored procedure.

I’ll make another post about clearing stored procedures from the plan cache! Thanks for reading, stay tuned!

Index maintenance freebies

I didn’t expect anything for free in index maintenance. After all, it takes a lot of CPU and transaction log space to remove fragmentation.

Let’s talk about two things that SQL Server does for us: one statistic is created per index we create, and when we rebuild that index, we get fresh statistics. We can also update statistics with full scan on our own, without needing to rebuild the index.

For all the time we spend rebuilding our indexes, often the big performance gain we get is from the fresh statistics and those statistics are made with full scan.

Let’s get some proof

Using StackOverflow2010, here’s my index.

CREATE NONCLUSTERED INDEX ix_Location_CreationDate ON dbo.Users
(Location, CreationDate)
INCLUDE (Reputation);
GO

Now, let’s update the statistics with the automatic sample size.

UPDATE STATISTICS Users (ix_Location_CreationDate);
Statistics details in SSMS

I say that index needs to be rebuilt, at least for the purposes of this demo.

ALTER INDEX ix_Location_CreationDate ON dbo.Users REBUILD;

Now taking a second look at the statistics:

Moral of the post

Statistics are automatically updated with the default sample size when a certain amount of data changes. I won’t talk about what that certain amount is, because it changes in major versions of SQL Server. What that means to us is that data changes can occasionally change statistics, which can mean worse performance.

Then, when the index maintenance jobs run and rebuild the indexes, the statistics get a full sample of the data. This means that your performance might improve from fresh statistics alone.

Stay tuned!

Query tuning: The IN clause

Update (2019/02/08): Originally the index definition on this post was on Users(DisplayName) INCLUDE Age. This was preventing an Index Seek because I wanted to show an Index Scan. I didn’t mention it in the original, but it’s clear to me that I made a mistake. Thank you to Bryan and John in the comments for pointing this out. Given that information I have re-written this post.

This post will cover the IN clause and another way to rewrite the same logic. I don’t intend to say that IN is better or worse than other T-SQL, I just want to showcase what it does.

We’ll jump right into the demos. I’m using StackOverflow2010 for this, and I’m going to create an index to be used by this query.

CREATE NONCLUSTERED INDEX ix_Age_DisplayName on Users (Age)
 INCLUDE (DisplayName)
SELECT DisplayName
FROM Users as u
WHERE Age IN (96,97,98,99,100)

Okay, cool. Let’s take a look at the Index Seek.

I want to focus on the bottom part. SQL Server decided to split our query into a series of Seek Keys.

This has interesting implications for how our query was optimized. Let’s take a look at another way of writing the same query.

SELECT DisplayName
FROM Users as u
JOIN (SELECT 96 as Age UNION ALL
SELECT 97 as Age  UNION ALL
SELECT 98 as Age  UNION ALL
SELECT 99 as Age  UNION ALL
SELECT 100 as Age ) as A1 on A1.Age = u.Age

This query will get the same result set. This time, let’s run both queries in the same batch. Ignore the Query Cost, just look at the different execution plans.

This is what query tuning is all about. Rewriting a query in two different ways to see if the optimizer will pick a different execution plan.

Comparing the IN clause vs the UNION ALL

There’s two significant differences in these plans. Let’s take a look at the execution plans, using the execution plan comparison feature in Management Studio.

Click on the whole comparison if you’re curious. I’ll zoom in on the differences below. The first plan using the IN clause is on the left. The second plan using the UNION ALL is on the right.

One thing to note is the Optimization level is different. The first query using the IN statement only received trivial optimization while the UNION query received full.

Taking a look at how the predicates were applied

I showed how the Seek Keys were applied above, but here’s the predicates from the Index Seek when using the UNION ALL approach:

And of course, the number of rows read:

Moral of the post

The point of this post is that query tuning can be as simple as re-writing the IN clause. I don’t want to say that either way is better, since it depends on your environment.

Don’t rewrite code unless there’s already a performance issue, and if you do, test it thoroughly.


My alternative to sp_WhoIsActive

I use sp_WhoIsActive a lot. I’m extremely grateful for Adam Machanic writing it. It has tons of options that let you specify exactly the information that you need for troubleshooting.

So why did I write a different query to get activity?

There’s some systems where sp_WhoIsActive is too slow. It could be resource related, like CPU, memory, or TempDB pressure, or it could be the DMVs. I’ll talk about that later, I wanted to introduce the idea that there’s situations where you can’t use sp_WhoIsActive.

In that kind of system, you need a lightweight query that can still get the SQL text that the users submitted, along with some similar metrics that you’re used to seeing.

Just three DMVs for this query

I’m just using dm_exec_requests, dm_exec_sessions and dm_exec_input_buffer.

SELECT s.session_id, 
	r.start_time, 
	s.host_name, 
	s.login_name,
	i.event_info,
	r.status,
	s.program_name,
	r.writes,
	r.reads,
	r.logical_reads,
	r.blocking_session_id,
	r.wait_type,
	r.wait_time,
	r.wait_resource
FROM sys.dm_exec_requests as r
JOIN sys.dm_exec_sessions as s
	 on s.session_id = r.session_id
CROSS APPLY sys.dm_exec_input_buffer(s.session_id, r.request_id) as i
WHERE s.session_id != @@SPID
and s.is_user_process = 1 
--Remove the line above if you want to see system processes

Now, I want to show you a side-by-side comparison of the results. The result sets are very similar, on purpose because I tried to get the same information from dm_exec_requests and dm_exec_sessions.

I’m running a workload using SQLQueryStress, another tool from Adam Machanic. Please click the image to view the full image, they’re huge screenshots.

First, the results from sp_WhoIsActive.

Partial column list of sp_WhoIsActive, there’s more columns available

Now the results from my query.

My query, current activity.

Pros and Cons of each query

Let me the first one to say: sp_WhoIsActive is better. For 99.9% of servers, you want to use sp_WhoIsActive. It’s more user-friendly, it’s more accurate, and it has many more DMVs used to gather information.

There’s also the matter of the sql_text vs event_info. In sp_WhoIsActive, you’re seeing the exact snippet of sql text that’s currently running. This is awesome, and much better.

However, I noticed that some of my SQL Servers would take a really long time to access the DMVs for sql text. To reduce that overhead, my query uses event_info, which will include information like “@PostType = 3” which is the literal and entire text that the user submitted to SQL Server.

If you find my query useful

If this post is useful to you, please let me know. I’m very open to suggestions and ideas on how to improve my version!


Memory Grants part 6: Memory used in aggregate functions (Min/Max/etc)

So far in this series, I’ve been focusing on the Sort operator. It’s pretty easy for demos since I can just write a statement with an ORDER BY and there will be memory requested.

However, there’s another way to get a memory grant easily. That’s when you need to do some aggregation, such as MAX or MIN.

Starting with a demo in StackOverflow2010

SELECT P.OwnerUserId
	,COUNT(*) as count_star
FROM Posts as P
GROUP BY P.OwnerUserId

This query is counting Posts per OwnerUserId, which is the current owner of the Posts.

First, let’s take a look at the query’s overall memory grant.

That’s for the whole query. Luckily, this query only has one operator that could use memory, the Hash Match (Aggregate). If you want to know which operators used memory, look for the Memory Fractions property in the execution plan.

Let’s take a look at that Hash Match’s properties

There’s our memory usage! However, it wasn’t enough memory for the query. While the query was running, it had to use some TempDB space to store the rest of the data, which we see in the warnings at the bottom.

TempDB spills deserve their own blog post. For now, I’ll just show exactly how much data was spilled to TempDB:

I wanted to write this post to show that using an aggregate like a COUNT will request a memory grant. It’s also important to note that if you include larger columns inside the query, you’ll get a large memory grant.

Using an aggregate like MIN or MAX on a large column

To demo a larger column in this query, I’ll add the Body column from the Posts table. It’s defined as Nvarchar(max).

SELECT P.OwnerUserId
	,MIN(Body) as smallest_post
	,COUNT(*) as count_star
FROM Posts as P
GROUP BY P.OwnerUserId

Now, the point of this change was not to remove the TempDB spill, but I do find it interesting. Here’s the new memory grant:

Now that we included a larger column in our aggregate, our query requested a couple hundred extra MBs of memory. It only used 20 MB but requested much more, because the Body column is nvarchar(max). If you’re interested in memory grants and data types, I have a post on that.

That’s the end of this post. If you’re curious about Hash Matches, take a look at Bert Wagner’s post on Hash Match. I’ll look at some other reasons for a memory grant beyond just the aggregates in a later post too. Stay tuned!

The Execution plan comparison feature (in SSMS)

Did you know that you can compare two execution plans in SQL Server Management?

It’s really cool. I use it a lot, as my first stop to compare performance. Let’s take two execution plans from my series on parameter sniffing.

Demo comparing execution plans

CREATE PROCEDURE [dbo].[QueryPostType] (@PostType INT) as
BEGIN

SELECT PostTypeId, Tags, Body 
FROM Posts 
WHERE PostTypeId = @PostType

END
GO
exec QueryPostType @PostType = 1

--I cleared the plan cache before running this second test.

exec QueryPostType @PostType = 3

We’re in the StackOverflow 2010 database. The PostType parameter will give us these two execution plans.

In this example, we can see there’s different operators on the Posts table. But in the real world, execution plans are much more complex. That’s where execution plan comparison comes in. Just save one of the execution plans then right-click and pick compare execution plans.

Our first view looks like this, which isn’t super useful.

But there’s a better way. First, uncheck the box says “Highlight similar operations” and then check “Highlight operators not matching similar segments”

Great! So if we pick the SELECT operators. Take a look at all the differences that are highlighted.

We see in the parameter list that each plan was compiled for a different compiled value. Take a look at the Actual Number of Rows, and all the other differences.

Thanks for reading! I hope this was a useful starting place when you’re comparing execution plans. Stay tuned.

It’s always parameter sniffing (Part 2): SET options

This is the sequel to “It’s always parameter sniffing (part 1).” In that post, we identified the stored procedure, and found a plan in cache that had some weird execution times.

This time, we’ll try to reproduce the issue in SQL Server Management Studio, and I’ll show why you need the SET options from the plan cache.

The setup

We’re using the stored procedure, QueryPostType, which takes a parameter of PostTypeId. In StackOverflow2010, the Post Type 1 has 1.1 million rows in the Posts table, and Post Type 3 has 28 rows.

The user calls in and tells us that they’re trying to find all the Post Types of 3, so it should be easy to reproduce, right? I’ll return statistics time to show you how long it took to execute on my machine.

set statistics time on;
exec QueryPostType @PostType = 3;

-- SQL Server Execution Times:
-- CPU time = 0 ms,  elapsed time = 88 ms.

Based on those results, the query runs fast in SSMS. If you’ve been doing performance tuning for a while, you’re ready for this next statement.

The query runs fast in SSMS but slow in the app!

To me, that means that we didn’t get the right plan from cache. For some reason, our query didn’t retrieve a cached plan. It would be really nice if we could use the “RetrievedFromCache” value inside execution plans…but it’s just not reliable.

So what do we do now? In my opinion, our next step is to check the “SET” options. These are settings that users can change on their applications/connections, and they will give a separate execution plan when used.

Checking settings on the cached plan

Let’s check on our query’s settings in the execution plan, and then we can check on the plan in cache.

These are the settings and actual execution plan from the query above.

Now let’s query the plan cache and check out the plan in there. I’m returning the execution count too, see why in a second.

SELECT dm_plan.query_plan, 
       stat.execution_count
FROM sys.dm_exec_procedure_stats as stat
CROSS APPLY sys.dm_exec_query_plan(stat.plan_handle) as dm_plan
WHERE object_name(stat.object_id) = 'QueryPostType'
Guess which one is from the application?

In this example, the plan with 126 executions is from the application. In the real world, that number could be much, much higher. Let’s open that plan and see what settings were used there.

Here’s the plan it created, just in case you’re curious about the shape of the plan in cache.

Arithabort was off in the application

This post isn’t about the “right” settings, it’s about retrieving the right plan from cache! Let’s go back to our previous example and turn it off, then hopefully we’ll retrieve the plan from cache.

SET STATISTICS TIME ON;
SET ARITHABORT OFF;
EXEC QueryPostType @PostType = 3;
-- SQL Server Execution Times:
-- CPU time = 1468 ms,  elapsed time = 1493 ms.

I’ve never been so happy to see parameter sniffing. And we even got the index scan plan.

I hope this was useful! This happened to me today and I had to find the SET options from the plan cache. Stay tuned.

Memory Grants part 5: Query hints

Proceed with caution, if you’re thinking of using query hints. This post will specifically cover min_grant_percent and max_grant_percent.

My opinion on query hints is that you’re often better off tuning the query, than using a query hint. Especially if you have time to consider using a query hint, you should take enough time trying to tune the query first.

Okay, now that we’re done with the disclaimers, what does max_grant_percent do?

Max_grant_percent will set a maximum memory grant for the query. The percent is based on the maximum memory available for a query, formula here.

Without a hint, the formula is:

(Maximum SQL Server memory * 90%) * 25%

Demo time! First, creating the table from Memory Grants part 3.

CREATE TABLE BigMemoryGrant (Id INT IDENTITY(1,1), column1 NVARCHAR(max));
GO

CREATE CLUSTERED INDEX cx_BigMemoryGrant on BigMemoryGrant(Id);
GO

INSERT INTO BigMemoryGrant
SELECT 'A'
FROM sys.messages

INSERT INTO BigMemoryGrant
SELECT 'B'
FROM sys.messages

INSERT INTO BigMemoryGrant
SELECT 'C'
FROM sys.messages

And we’ll use the same query. I’ll run it again for a baseline.

SELECT * FROM BigMemoryGrant
ORDER BY column1
1.82 GB Memory grant with no hint

Add in max_grant_percent.

SELECT * FROM BigMemoryGrant
ORDER BY column1
OPTION(max_grant_percent = 50)
913 MB

Perfect! So the query still desires about 4 GB of memory, but since we applied our hint, the query receives 50% of the maximum memory grant.

Then with the hint, it becomes:

(Maximum SQL Server * 90%) * 25% * (max_grant_percent value)

What about min_grant_percent?

We need a query that gets a small memory grant to test this hint. I’ll re-use the SmallMemoryGrant table from Part 4.

CREATE TABLE SmallMemoryGrant (Id INT IDENTITY(1,1), column1 NVARCHAR(max));
GO
 
CREATE CLUSTERED INDEX cx_SmallMemoryGrant on SmallMemoryGrant(Id);
GO
 
INSERT INTO SmallMemoryGrant
SELECT top 10 'A'
FROM sys.messages
 
INSERT INTO SmallMemoryGrant
SELECT top 10 'B'
FROM sys.messages
 
INSERT INTO SmallMemoryGrant
SELECT top 10 'C'
FROM sys.messages
 
--Run query once to see the memory grant size, get actual execution plan
SELECT * FROM SmallMemoryGrant
ORDER BY column1
With no hint, 1 MB memory grant
SELECT * FROM SmallMemoryGrant
ORDER BY column1
OPTION(min_grant_percent = 50)
With 50 percent min_grant_percent, we get 913 MB memory for this query

Interesting! I haven’t used min_grant_percent, but it has the inverse behavior of max_grant_percent. Both hints are based on the maximum query memory grant formula, but they move the memory grant in different directions.

(Maximum SQL Server memory * 90%) * 25% * (min_grant_percent value)

When are these hints useful?

As stated in the disclaimer, when your query is still getting the wrong memory grants after hours and hours of performance tuning. Once you’ve done that much legwork, and tested multiple parameters, in multiple environments, I could possible use this hint.

In my experience, this hint becomes useful when a query has very inaccurate row estimates. That can mean other performance issues are there, which is why I recommend query tuning so much.

Stay tuned! I hope you’re enjoying this memory grant series.

Memory Grants part 4: The Resource Semaphore

Part of query memory grants, part 4! This post will cover the wait type RESOURCE_SEMAPHORE briefly, but the focus is on what a semaphore is.

What the wait? Why does my system have RESOURCE_SEMAPHORE waits?

SQL Server only has so much memory to distribute to its queries. To decide who gets that memory, by default there’s two things called semaphores in SQL Server. Let’s take a look at the semaphores before we go any deeper.

SELECT 
	resource_semaphore_id,
	total_memory_kb,
	available_memory_kb,
	grantee_count,
	waiter_count,
	pool_id
FROM sys.dm_exec_query_resource_semaphores

If you want to see the documentation, click away.

So I said there’s two, but the DMV shows four. Why is that? Well, the answer is in the last column. There’s a pool_id. The pool_id comes from Resource Governor pools!

SELECT 
	pool_id,
	name
FROM sys.dm_resource_governor_resource_pools

Okay, so we’ve established that there’s two semaphores for the default Resource Governor pool, which is where queries normally run. Don’t worry about the internal resource pool at this time.

Some quick math on the available memory. My SQL Server has current max memory set to 10 GB. It looks like semaphore 0 has 7.3 GB available, and semaphore 1 has 300 MB allocated.

So how do the semaphores work? Why do they exist?

I think the best way to describe the semaphores would be to show them in a demo. Let’s do that.

I’m going to take the query from Memory Grants part 3 because it uses a lot of memory.

SELECT * FROM BigMemoryGrant
ORDER BY column1

Here’s the memory grant from that query:

1.8 GB Memory Grant

Okay, we’re ready. Using SQLQueryStress , I’ll run the query eight times. Since our query’s memory grant is 1.8 GB and semaphore 1 is 300 MB, we’ll ignore this smaller semaphore. The big semaphore has 7.3 GB available, and we’re running eight queries so there won’t be enough room for all the queries.

SELECT 
	resource_semaphore_id,
	total_memory_kb,
	available_memory_kb,
	grantee_count,
	waiter_count,
	pool_id
FROM sys.dm_exec_query_resource_semaphores
WHERE pool_id = 2 
AND resource_semaphore_id = 0

So according to this DMV, there’s only 3 queries with memory grants, while the remaining 5 queries have to wait for space in this semaphore. This is where the wait type comes in. When a query is sitting as a waiter, it will display the wait type RESOURCE_SEMAPHORE.

I don’t know why there’s extra available memory in this semaphore! It looks like there’s about 1,827,576 KB available and the query will request 1,827,560 so I’d think that one more query could get a memory grant. I’d be happy to know why though, if you know please leave a comment.

Here’s a quick look at what this same issue will look like in sp_WhoIsActive:

So what are these semaphores?

Think of them as a throttling mechanism for memory, to prevent all the server’s memory from being consumed. This way, there’s a system controlling access to the large semaphore, in this case semaphore 0.

The two systems are separate, so there’s still 300 MB available for queries that don’t need a lot of memory. Let’s take a look at a demo.

First, we need a table for a small memory grant. I’ll copy the script from part 3, but reduce the data size by a lot.

CREATE TABLE SmallMemoryGrant (Id INT IDENTITY(1,1), column1 NVARCHAR(max));
GO
 
CREATE CLUSTERED INDEX cx_SmallMemoryGrant on SmallMemoryGrant(Id);
GO
 
INSERT INTO SmallMemoryGrant
SELECT top 10 'A'
FROM sys.messages
 
INSERT INTO SmallMemoryGrant
SELECT top 10 'B'
FROM sys.messages
 
INSERT INTO SmallMemoryGrant
SELECT top 10 'C'
FROM sys.messages

--Run query once to see the memory grant size, get actual execution plan
SELECT * FROM SmallMemoryGrant
ORDER BY column1

Great! Now, running our first workload of BigMemoryGrant eight times, and one execution of the SmallMemoryGrant.

Moral of the post: Query memory and how it fits into semaphores

So, while all the big memory grant queries are waiting for space in the big memory semaphore, the small memory grant query can run since there’s a separate semaphore for it.

I hope this was useful! Stay tuned for more in this memory grant series.

By continuing to use the site, you agree to the use of cookies. more information

The cookie settings on this website are set to "allow cookies" to give you the best browsing experience possible. If you continue to use this website without changing your cookie settings or you click "Accept" below then you are consenting to this.

Close