Missing index requests look like Staple’s Easy button. We just want to press it and get faster performance. I’m sorry to report that the missing index in your execution plan might not be the answer. It might also have additional missing index requests that you didn’t know about!
First, we need a query
I’m taking this example directly from my Reading Execution Plans Successfully presentation and I used the AdventureWorks2014 database to run all these tests.
SELECT *
FROM AdventureWorks2014.Production.TransactionHistoryArchive
WHERE TransactionDate = '2011-05-01'
UNION ALL
SELECT *
FROM AdventureWorks2014.Production.TransactionHistoryArchive
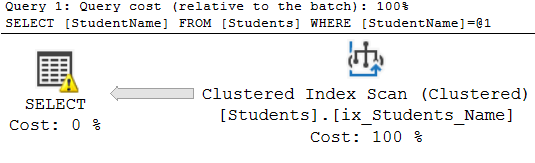
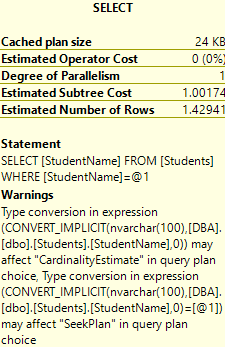
WHERE ActualCost IN(50, 25, 30);Keep in mind that there’s no index on either ActualCost or TransactionDate, by default in AdventureWorks. Let’s run that query and get the actual execution plan.
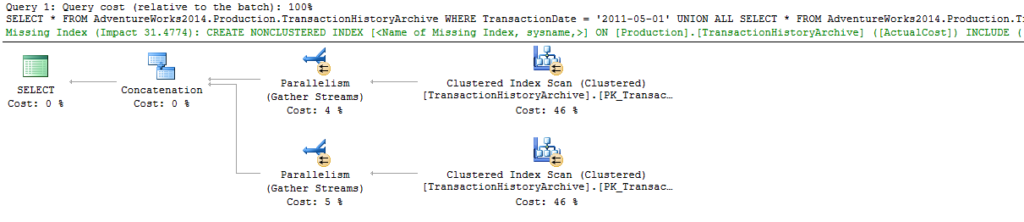
SQL Server is requesting a missing index with an impact of 31, on ActualCost. I’ll refer to this as missing index #1. Here’s the definition of the missing index request.
USE [AdventureWorks2014]
GO
CREATE NONCLUSTERED INDEX [<Name of Missing Index, sysname,>]
ON [Production].[TransactionHistoryArchive] ([ActualCost])
INCLUDE ([TransactionID],[ProductID],[ReferenceOrderID],[ReferenceOrderLineID],[TransactionDate],[TransactionType],[Quantity],[ModifiedDate])
GO
This is missing index request #1, and by default, this is the only missing index we’ll see by looking at the graphical execution plan. There’s actually a missing index request #2, which we can find in the XML (I know, it’s a little ugly to read. Bear with me).
Missing index request #2
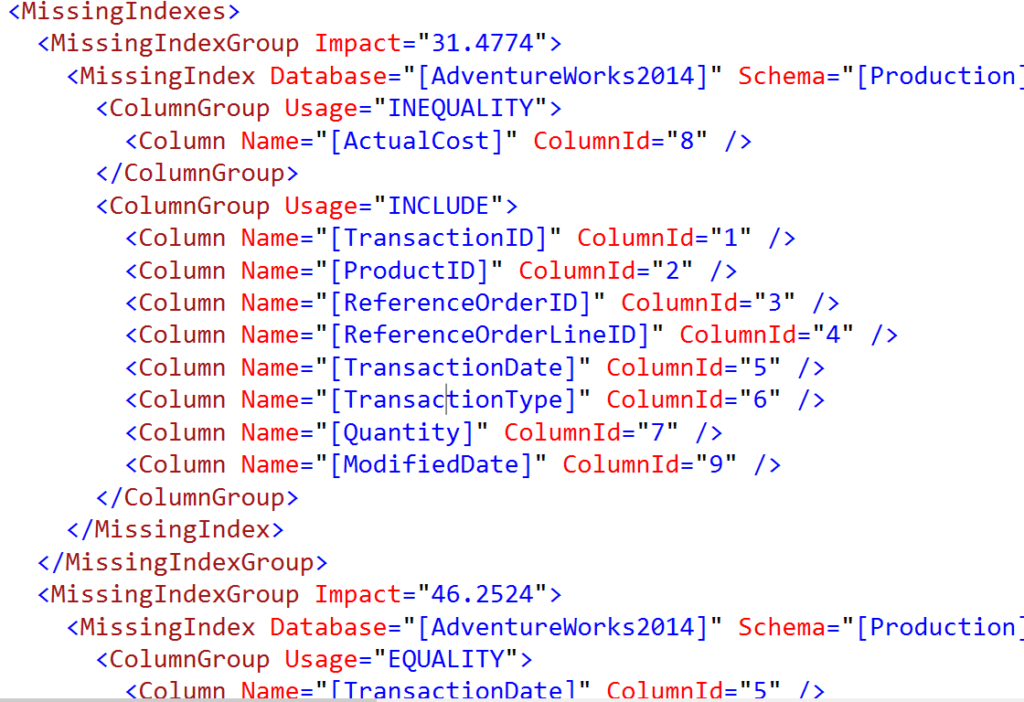
That’s a snippet of the XML from the same execution plan. At the top, the 31 cost missing index request is for missing index #1. Right below that, there’s the entire definition of another missing index, request #2.
I find this example interesting because the query starts with a ‘where’ clause on the TransactionDate, and the server estimates the impact of that missing index to be 46, which is higher than 31. Yet when we look in the graphical view, the only request for an index that we can see is request #1, on ActualCost.
What’s the moral of this post?
This is just one of many reasons that missing index requests can be unreliable. I wrote this example specifically to demonstrate that there can be more than one missing index request in a single query.
Stay tuned! More performance posts coming out soon.