I previously wrote about measuring wait statistics. This matters a lot, because you can track historically what wait statistics are generated during your normal workload, and then compare to your current wait statistics.
Once you’re measuring that, what else should you be measuring? Well, I’d say your plan cache. Lots of people have their personal plan cache scripts. I’m just going to use sp_BlitzCache, for a few reasons. First, it’s free. Second, setting this up is super easy.
Go get the First Responder Kit
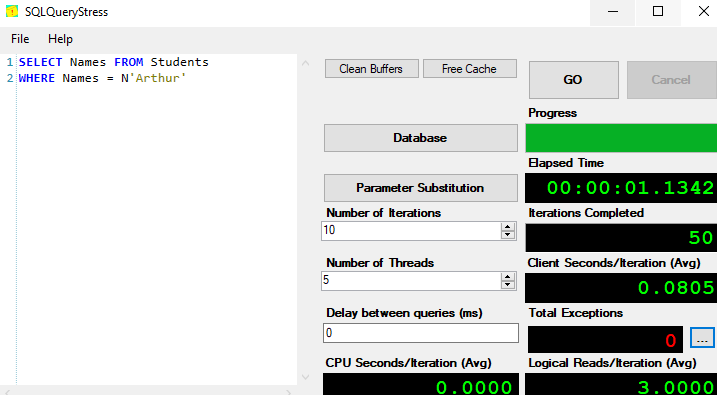
Once you have that set up and installed, logging the top queries from your plan cache is super easy. Let me run a workload from SQL Query Stress to get some queries into cache.
I didn’t give the table definition on purpose, I’ll provide that later. First, let’s use our DBA database and log the plan cache to a table.
USE DBA
GO

EXEC sp_BlitzCache @OutputDatabaseName = 'DBA', @OutputSchemaName = 'dbo', @OutputTableName = 'PlanCacheLog'
GO
Now, let’s take a look at this data.
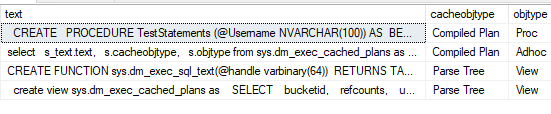
SELECT * FROM PlanCacheLog
That’s a lot of information. Scroll all the way to the right side.

Among a lot of other information we’ve captured, we have both the query text and the query plan from cache, along with the CheckDate telling us when the plan cache was written to this table.
This kind of information is invaluable for performance tuning, especially if there was an issue at that time.
About SQL Server monitoring
In the post I wrote about monitoring wait statistics , and in this post, I’m describing ways to gather troubleshooting data. You can put these two scripts into SQL Agent jobs, or run them at your leisure to build your own monitoring.
These are not a replacement for a good monitoring tool, like SQL Sentry, Idera Diagnostic Manager, etc. If this data is useful to you, I recommend looking into one of the performance monitoring vendors to see how their solutions could help you.
Thanks for reading! Stay tuned, and read on if you want to hear about the problematic query example.
Finally, about the problematic query
I use this query to demonstrate implicit conversions. Here’s the table definition and the script I was using in SQL Query Stress.
CREATE TABLE dbo.Students(Names varchar(100) NULL)
GO

CREATE NONCLUSTERED INDEX IX_Names
ON dbo.Students(Names)
GO

INSERT INTO Students
SELECT DisplayName FROM StackOverflow2010.dbo.Users
GO
--299,611 rows

SELECT Names FROM Students
WHERE Names = N'Arthur'
And the resulting execution plan:
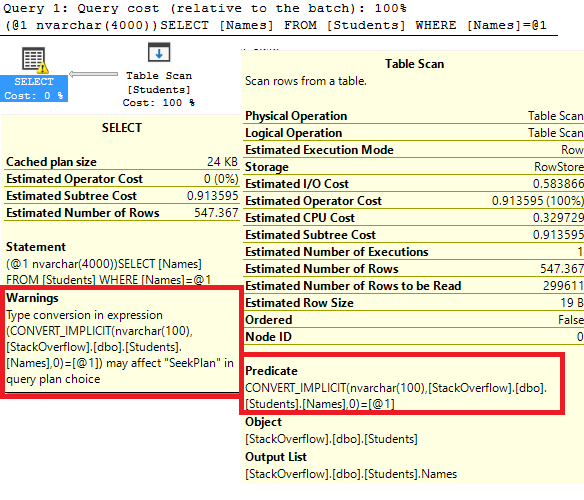
The “N” before Arthur is declaring the value as an NVARCHAR data type. Therefore, when the query runs on this table, it has to scan the entire table. Fixing this data type will dramatically change this execution plan.
SELECT Names FROM Students
WHERE Names = 'Arthur'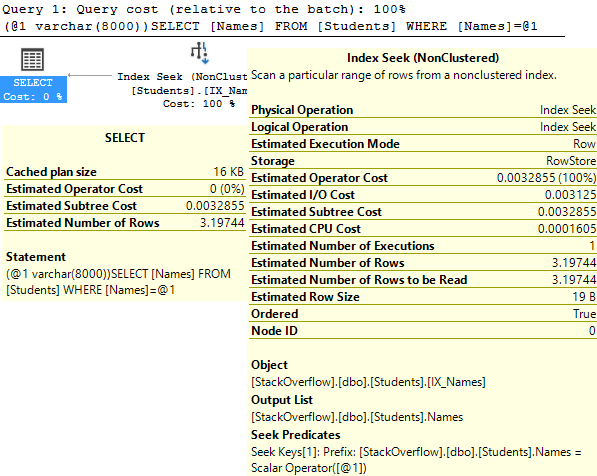
Why? (Implicit Conversions)
I’ve found a lot of implicit conversions while working on performance. The reason that SQL Server does an implicit conversion is because the data types are compatible. Varchar values can be converted to nvarchar like in this case, and there’s a whole list of compatible data types.
Implicit conversions are a problem when an entire column has to be converted. In the highlighted red box above, look at the CONVERT_IMPLICIT. It’s a function wrapped around the column, Names. When the correct data type is used down here at the bottom, it’s not an issue.
Implicit conversions deserve their own post, I don’t feel like I did justice to how much of a problem they can be. Stay tuned for more!