A lot of us turn to execution plans when we see a slow running query, and it’s not uncommon to see missing index requests. If you’re a developer who comes across a missing index request in their execution plan, keep in mind that there can be more than one request in a single plan!
Besides that fact, your SQL Server is keeping track of the missing indexes that your queries request. They’re all stored in dm_db_missing_index_details, and a few other views.
The limitations of dm_db_missing_index_details
Here’s the biggest limitation: This DMV is reset every time your server reboots. It’s also database-specific. Oof. Well, what can we do about that?
I’ll provide a sample script of a way to collect this information at the end of this post. Let’s walk through a query that requests a missing index, then log that.
SELECT Body FROM Posts
WHERE AnswerCount = 10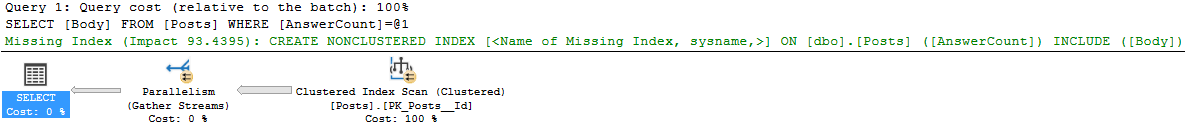
Great! Now we need a table. Please feel free to make your own, here’s one I created for this example.
Create table and script to store missing index details
CREATE TABLE MissingIndexLog
(Id BIGINT IDENTITY(1,1),
table_name nvarchar(4000),
database_name nvarchar(128),
equality_columns nvarchar(4000),
inequality_columns nvarchar(4000),
included_columns nvarchar(4000),
user_seeks bigint,
user_scans bigint,
avg_total_user_cost float,
avg_user_impact float,
server_name nvarchar(128),
insert_datetime datetime2 DEFAULT(GETDATE()))
GO
And here’s our query to insert into that table. This query could be wrapped in a stored procedure if logging locally, or converted into two separate parts if you want to collect from a remote server.
INSERT INTO DBA.dbo.MissingIndexLog
(  table_name,
  database_name,
  equality_columns,
  inequality_columns,
  included_columns,
  user_seeks,
  user_scans,
  avg_total_user_cost,
  avg_user_impact,
  server_name)
SELECT statement,
   DB_NAME(detail.database_id),
   equality_columns,
   inequality_columns,
   included_columns,
   stat.user_seeks,
   stat.user_scans,
   stat.avg_total_user_cost,
   stat.avg_user_impact,
   @@SERVERNAME
FROM sys.dm_db_missing_index_details as detail
  JOIN sys.dm_db_missing_index_groups as groups
    ON groups.index_handle = detail.index_handle
  JOIN sys.dm_db_missing_index_group_stats as stat
    ON stat.group_handle = groups.index_group_handle
--1 row affected
Let’s take a look at the result set.

Excellent! So in the table name, we get the database name. We can also see the average user impact was logged directly from the execution plan I showed earlier.
I hope this was useful! I recommend at least logging this information between server reboots. Feel free to capture more frequently.
Stay tuned!