When the query plan hash is deceptive

When you’re querying the plan cache, you need to know the four primary objects: the query hash, query plan hash, sql handle, and plan handle. However, the query plan hash recently surprised me.

Take a look at this index (in StackOverflow2010)

CREATE NONCLUSTERED INDEX [ix_Location_CreationDate] ON [dbo].[Users]
       ([Location] ASC,
	[CreationDate] ASC)
INCLUDE ( [Reputation])

Okay, we have a nonclustered index. Now I want a query that uses this index, but also does a key lookup to the clustered index, looking for the UpVotes column.

SELECT 
	Reputation
	,UpVotes
  FROM [StackOverflow2010].[dbo].[Users]
  WHERE Location = 'United States'
   and CreationDate >= '2009-05-01' 
   and CreationDate <= '2009-05-10'

Here’s the execution plan.

The query plan hash is 0xD30D4B58F7A1E0A8

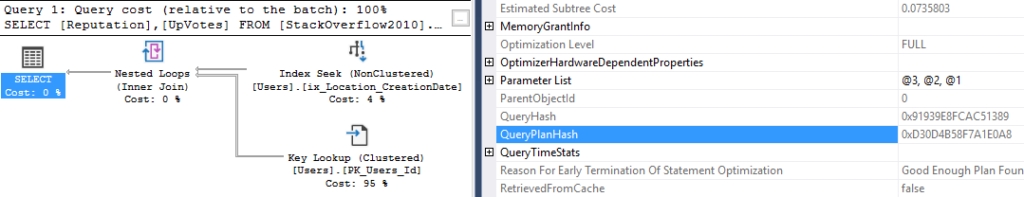
Now, let’s change the UpVotes column to EmailHash

SELECT 
	Reputation
	,EmailHash
  FROM [StackOverflow2010].[dbo].[Users]
  WHERE Location = 'United States'
   and CreationDate >= '2009-05-01' 
   and CreationDate <= '2009-05-10'

The new query plan hash is 0xD30D4B58F7A1E0A8, exactly the same as the first plan hash.

Surprised?

I was surprised at first. I expected a different query plan hash because there was a different column being returned. I think it makes sense though. The query plan hash is supposed to represent the structure of the plan, and in both examples, it’s the same indexes used for the seek, key lookup, and nested loop operators.

One bonus example

What if we add the UpVotes column to the WHERE clause instead of the SELECT clause?

SELECT 
	Reputation
  FROM [StackOverflow2010].[dbo].[Users]
  WHERE Location = 'United States'
   and CreationDate >= '2009-05-01' 
   and CreationDate <= '2009-05-10'
   and UpVotes = 50
Query plan hash is 0xD30D4B58F7A1E0A8

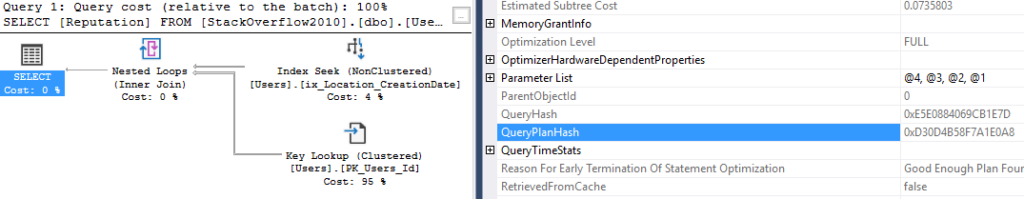
That’s the same query plan hash, even when there’s a new predicate in the WHERE clause.

I hope this was interesting! If you take a look at the query hashes (apologies for the size of the screenshot), they changed for each different query. Stay tuned!

Make sure your nonclustered indexes are enabled

I know this post might sound obvious. This is a very rare problem. But this actually happened to me, and it might happen to you!

Suddenly, all queries on a test system were running slowly

One morning, I was called into a system where every single query was running slowly. System resources like CPU and memory were over-utilized, and it looked like the entire system was struggling to keep up.

I checked wait statistics, PerfMon, and sp_WhoIsActive. These just further reinforced the idea that the system was experiencing a heavier workload than normal.

How it was discovered

There’s actually a really simple query to find out if your indexes are disabled.

USE [Your-database-here]
GO
SELECT name from sys.indexes WHERE is_disabled = 1

Unfortunately, enabling indexes isn’t as easy

Here’s the snippet from SQL Server Management Studio on disabling/enabling indexes:

That’s right, in order to re-enable an index, you have to rebuild it. Ouch.

How did the indexes become disabled?

Well, to disable an index, you have to run an alter index script on each index. In my situation, a script that disabled indexes ran on the wrong environment.

Thanks for reading! Hopefully this rare issue doesn’t occur to you. Stay tuned!


TempDB space isn’t free real estate

Using temp tables in SQL Server often seem like a great way to improve performance. But when everyone wants the same piece of land, you end up with contention or in the real world, very expensive houses.

TempDB contention example

To simulate a lot of sessions running at once, trying to use TempDB, I’m going to use the free SQLQueryStress tool written by Adam Machanic (Thanks Adam!).

Now I need a query that will consume a lot of TempDB space.

SELECT *
into #messages
FROM sys.messages

SELECT severity
FROM #messages
WHERE text = 'String or binary data would be truncated.'

I’ll run this query with 200 threads because I want a lot of contention.


Once I kick off that process, here’s a snippet of sp_WhoIsActive.


Repeat 200 times

What’s the issue?

Well, the issue is PAGELATCH_UP on the tempDB data files, in that screenshot it’s files 5 and 9. There’s a lot of writing on the internet about the best way to solve TempDB contention. If you only have one or two files in TempDB but you have lots of CPU cores, adding more TempDB files might help.

What’s the solution?

In this example, we could filter when we load into the temp table (or not even use a temp table at all). That’s one of my proposed solutions.

Once you have decided on the right number of tempDB files, you might still see this issue. That’s why I picked an example that does searching extremely inefficiently. I want to emphasize that tuning your queries will often provide much bigger benefits than trying to use administration to fix bad T-SQL.

Let’s do two things to the query from earlier. We don’t need to load into a temp table, and we don’t need to SELECT *, we just need the severity column. Both of these improvements will reduce the total amount of resources used.

SELECT severity
FROM sys.messages
WHERE text = 'String or binary data would be truncated.'

Time to take another look at sp_WhoIsActive.

What’s happening now? They’re still running?

Yes, but instead of waiting for resources, they’re all executing simultaneously.

Thanks for reading, stay tuned!


By continuing to use the site, you agree to the use of cookies. more information

The cookie settings on this website are set to "allow cookies" to give you the best browsing experience possible. If you continue to use this website without changing your cookie settings or you click "Accept" below then you are consenting to this.

Close