Here’s a link to the Microsoft documentation on this DMV.
This is part 1 in a series I’m writing about my favorite Dynamic Management Views in SQL Server. I’m going to talk about how they’re useful, and then build on each post in the series by showing they’re connected.
Why it’s useful
Well, as the name implies, this DMV shows all the current sessions connected to your system. When I think of current sessions, I often think about queries that users are running on the server, but there’s also system activity. When I’m troubleshooting, sometimes I want to see both user and system activity, and this DMV allows me visibility to both.
Useful columns to query
login_name: Find the user who’s executing the session on your server
host_name: Find the computer that’s hosting the session
reads, writes, and logical reads: Useful for judging the total activity of one session
is_user_process: 0 for system processes, 1 for user processes
status: There’s a few different status but the most important ones are sleeping or running
program_name: The name of the program used to create this session. See the example below
Example query using this DMV
SELECT host_name, login_name, writes, reads, logical_reads, program_name
FROM sys.dm_exec_sessions as s
WHERE s.is_user_process = 1
and s.status = 'running'
ORDER BY s.writes DESC
I’ve worked with a lot of great system administrators and developers. There’s one unusual thing about working with databases that’s often confusing for non-DBAs. This post is to help in those situations.
When an application is using 80-95% of a system’s memory, that’s concerning
Yes, even if it’s Chrome. Close some Chrome tabs please!
However, in the database world, your DBAs will tell you that it’s fine for SQL Server to consume lots of memory. They say that because databases want lots of memory by design. Databases use memory to store and retrieve data fast!
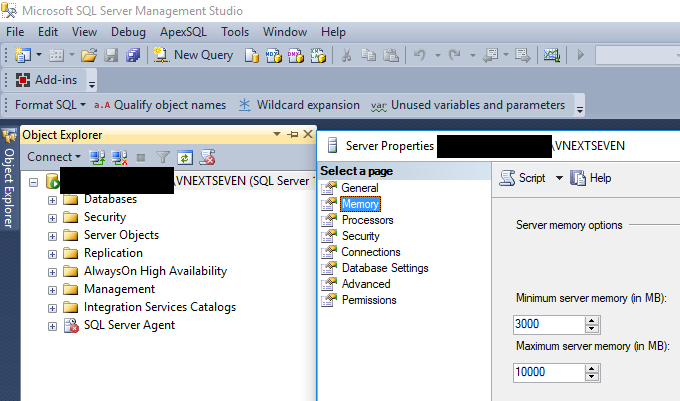
Your database administrators have control of how much memory is used by SQL Server
It’s right here, in SQL Server Management Studio. Right click on the server name, and go to properties.
Is 10,0000 MB the default setting?
No, I set that up for a very small server specifically for this demo. Don’t pick 10,000 just because I did.
However even in the latest version of SQL Server, the default setting is 2,147,483,647 megabytes. That does mean that SQL Server could eventually use up your entire system’s memory. Bummer.
What to do when SQL Server is using a lot of server memory
If you’re still worried about how much memory is being used by the SQL Server, check that setting. If your company has database administrators, talk to them. Check on the link for the default setting, there’s some general advice in there.
End of the post
The main moral of this story is: please don’t reboot your servers just because SQL Server is using a lot of memory. It will start to consume memory once it starts running again, and the process will repeat.
Using temp tables in SQL Server often seem like a great way to improve performance. But when everyone wants the same piece of land, you end up with contention or in the real world, very expensive houses.
TempDB contention example
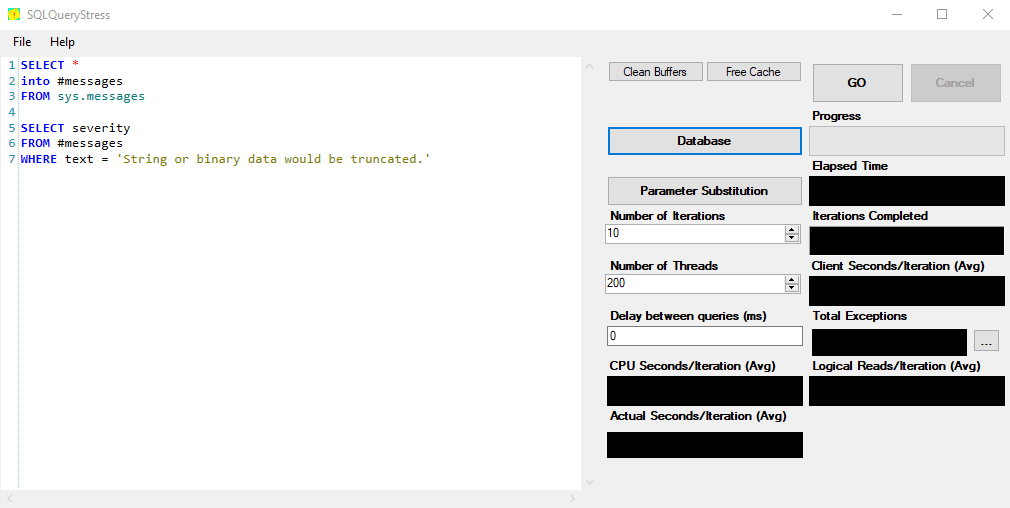
To simulate a lot of sessions running at once, trying to use TempDB, I’m going to use the free SQLQueryStress tool written by Adam Machanic (Thanks Adam!).
Now I need a query that will consume a lot of TempDB space.
SELECT *
into #messages
FROM sys.messages

SELECT severity
FROM #messages
WHERE text = 'String or binary data would be truncated.'
I’ll run this query with 200 threads because I want a lot of contention.
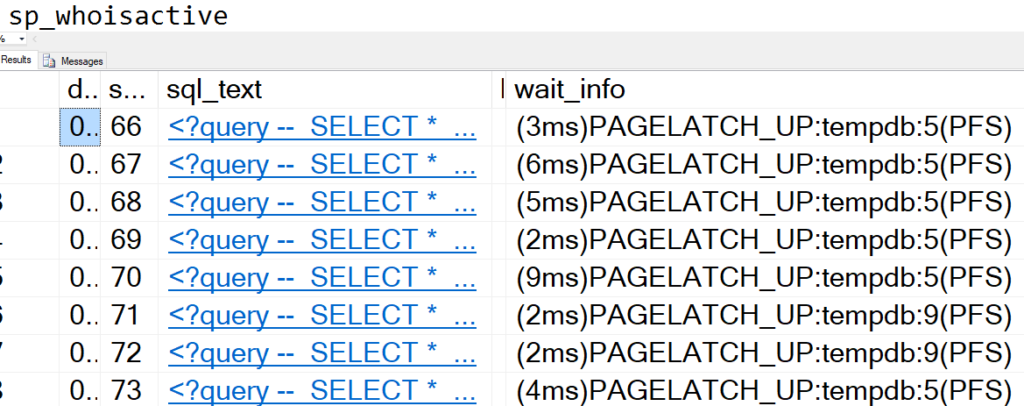
Once I kick off that process, here’s a snippet of sp_WhoIsActive.
Repeat 200 times
What’s the issue?
Well, the issue is PAGELATCH_UP on the tempDB data files, in that screenshot it’s files 5 and 9. There’s a lot of writing on the internet about the best way to solve TempDB contention. If you only have one or two files in TempDB but you have lots of CPU cores, adding more TempDB files might help.
What’s the solution?
In this example, we could filter when we load into the temp table (or not even use a temp table at all). That’s one of my proposed solutions.
Once you have decided on the right number of tempDB files, you might still see this issue. That’s why I picked an example that does searching extremely inefficiently. I want to emphasize that tuning your queries will often provide much bigger benefits than trying to use administration to fix bad T-SQL.
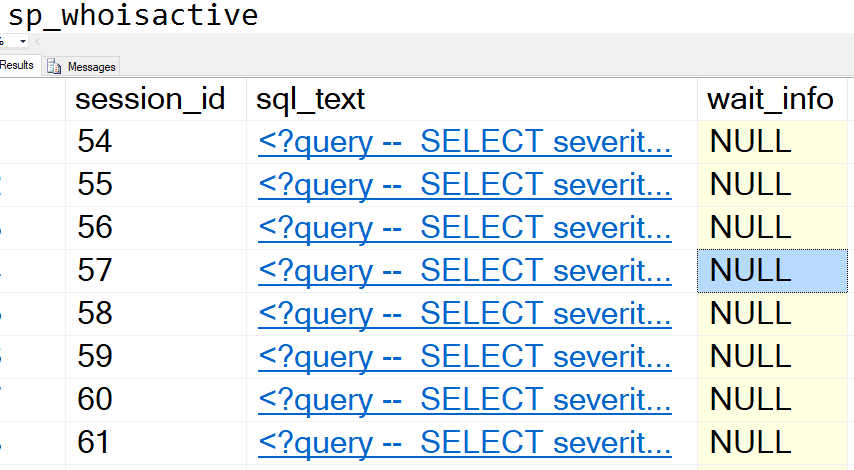
Let’s do two things to the query from earlier. We don’t need to load into a temp table, and we don’t need to SELECT *, we just need the severity column. Both of these improvements will reduce the total amount of resources used.
SELECT severity
FROM sys.messages
WHERE text = 'String or binary data would be truncated.'
Time to take another look at sp_WhoIsActive.
What’s happening now? They’re still running?
Yes, but instead of waiting for resources, they’re all executing simultaneously.
Some things in life we ignore. For example, the “check engine” light. That’s just there as a suggestion, right?
But when you’re performance tuning, you can’t afford to ignore the warning signs. I can’t count the number of times that I’ve found the issue with a query by looking at the warnings.
Enough talk, let’s look at an example
Let’s create a table of Students, with just one column.
CREATE TABLE [dbo].[Students]([StudentName] [varchar](100) NULL)
GO
CREATE CLUSTERED INDEX ix_Students_Name
ON Students(StudentName)
GO
I need some dummy data to really increase the numbers here, so I’ll load in the names from StackOverflow2010.
INSERT INTO Students(StudentName)
SELECT DisplayName
FROM StackOverflow2010.dbo.Users
Great! About 300,000 rows were loaded into my new table. Now I need to write a query. How about this query?
SELECT StudentName
FROM Students
WHERE StudentName = N'Arthur'
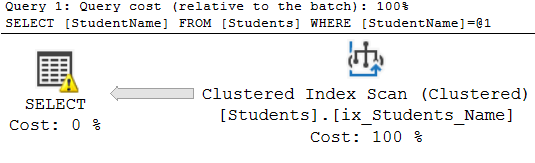
35 rows returned! Disclaimer, none of those users are actually me. This post is about the execution plan, so let’s retrieve the execution plan along with the io statistics by using set statistics io on.
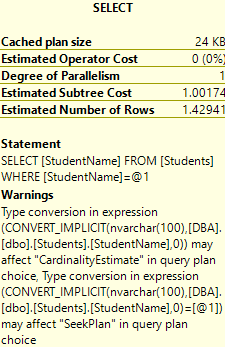
Ah, there’s the warning sign on the left there. Here’s the warning it’s giving us.
Type conversion in expression? What does that mean?
Well, because I used the “N'” prefix around my parameter of Arthur, I was using nvarchar as my data type, and the table’s data type is varchar. When the server received my request, it had to convert the entire column of StudentName into nvarchar before searching the list for the name I sent.
That’s called an Implicit Conversion, and this issue only gets worse as your data grows in size. Often, this issue doesn’t appear overnight. It can exist for weeks or months, just making each query run a little slower. Then in a few years, the query is slow and users start to complain. Since nothing has changed, it’s hard to track down.
Is it worth fixing?
I say absolutely yes. Let’s take a look at this example to see how much it will improve, and then I’ll talk more about the fix in the real world.
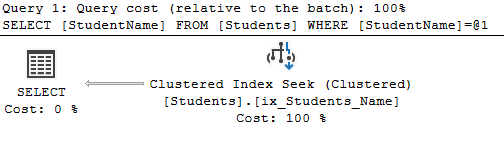
SELECT StudentName
FROM Students
WHERE StudentName = 'Arthur'
Ah, that’s better. Not only has the warning disappeared, but the index scan in the execution plan changed.
What happens in the real world?
The real world is never as easy or simple as a demo environment like this. If your company is international, I’d argue that the correct choice would be to change the data type of the column to nvarchar. That’s a lot harder than the easy fix in my demo.
At this point, when you have a slow query and there’s an implicit conversion that you believe is influencing the execution plan, it’s time to start asking questions. Start by finding your favorite application developer and ask them how they use the column.
More warning sign posts to come
I want to leave an honorable mention for the other warning signs that show up in execution plans, specifically the excessive memory grant warning. I’ll talk about that in the future, stay tuned!
It’s no secret that a lot of DBAs don’t like the NOLOCK hint. Often, people will discuss the myriad of issues that can happen.
Introduction to NOLOCK
If you aren’t familiar with NOLOCK, it’s a query hint that can be applied to each table in a query. This hint tells SQL Server to change isolation level from Read Committed to Read Uncommitted. In plainer words, the query can now read data before and during the process of writing to the storage.
The main reason that this is bad is that your query can return bad data. That’s pretty bad.
But let me introduce you to another issue that can occur, which is blocking on the schema, AKA the wait type LCK_M_SCH_S.
What does LCK_M_SCH_S mean?
It means that the current session is trying to acquire a lock on the schema to make a change to an object in the schema. You might think that your environment doesn’t make changes to the schema too often, but there’s a few scenarios when that kind of lock is required.
Let’s say we have a production incident, and we need to drop an index. Let’s try to do that while there’s a query running on this table (using StackOverflow 2010).
SELECT *
FROM Comments (NOLOCK)
On my machine, this query takes almost a minute to run. While this query runs, let’s create an index on this table.
CREATE NONCLUSTERED INDEX
ix_test ON Comments(Score)
Taking a look at activity using sp_WhoIsActive, we can see that creating the index and running the query are compatible.
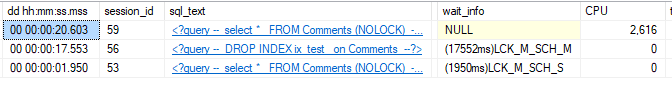
But here’s the tricky part: even though we could create the index, we can’t get rid of it now! Let’s try to drop it, and I’ll re-run the same Comments query first.
I also start a new “SELECT *” query, but it looks like now that I’m dropping an index, that new query is now waiting. Both queries haven’t done any work yet, just waiting for session 59 to finish.
What’s the solution?
Well, honestly there’s no easy fix once your environment has queries with NOLOCK applied in Production. You can try to avoid this issue by never dropping an index in Production, but what’s to stop another DBA or someone with sysadmin rights from creating an index or two?
SQL Server provides performance tuners with two main methods of reviewing query performance, the estimated and actual execution plans. The estimated plan can be retrieved quickly, since the query doesn’t have to be executed. Alternatively, the actual plan will require you to execute the query entirely but it’s often worth the wait. The estimated plan is only as good as the estimates used to generate it, so as performance tuners, we want to review what actually happened.
So here’s the catch
In the real world, when you’re troubleshooting an issue, waiting for the entire query to execute is painful. If the query takes over 30 seconds, I know I’ll start to get impatient and I’ll get curious about what’s taking so long. This is where the estimated plan comes into play. While we’re waiting for our actual query to execute, let’s talk about one big reason we’d want to retrieve the estimated plan: parameters.
Parameters?
Yes, the parameters that were used to compile the plan. When SQL Server generates an execution plan, it records the parameters that were used. Here’s another tricky part: those might not be the same parameters that you’re using to test the query. Let’s take a look at an example using the Stack Overflow database.
In the world of Stack Overflow, the Posts table has all the questions and answers from the site. There’s a lot of those questions and answers, but there’s just a few wiki type posts.
Here’s my stored procedure to retrieve all the posts of a certain type:
CREATE PROCEDURE [dbo].[QueryPostType] (@PostType INT)
AS
BEGIN

SELECT PostTypeId,
	  Tags,
	  Body
FROM Posts where PostTypeId = @PostType

END
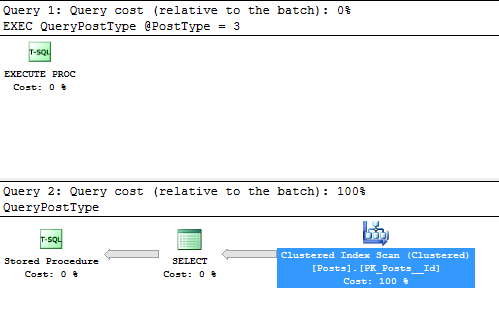
Now to actually test this, we need to run the stored procedure once.
EXEC QueryPostType @PostType = 1;
Alright. Executing the query with the parameter for the questions, post type of 1, should put that plan into the plan cache. Let’s take a look at the estimated plan for a different parameter, 3, which is the wiki post type.
EXEC QueryPostType @PostType = 3;
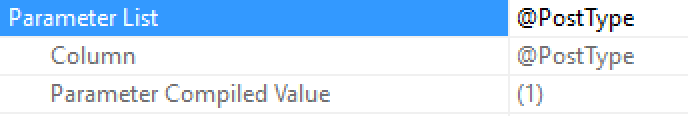
Just right click on that “SELECT” and look at the parameters. Here’s the useful part:
That’s all I have for this reason and this post.
I just wanted to provide the parameters in defense of estimated plans. This trick becomes really useful if you’re trying to determine if your query is a victim of parameter sniffing, since you can see what parameters were sniffed and placed into cache.
It’s been a while since I’ve posted a blog post! In the meantime, I gave a new presentation at GroupBy.org. Check it out here and find the slides/demos here. The presentation is up on YouTube and the transcript is available on the link, so it’s pretty easy to access. GroupBy conference was the biggest event I’ve ever been a part of, and it was such an incredible experience.
Preparing for The Perfect Index
I spent a long time preparing to give this presentation. I had three months to prepare but I didn’t start preparing until about four weeks out. This was a mistake. I knew what I wanted to say, but I procrastinated so much that I had to start rushing about a week before the conference. That’s when I really kicked it into gear and I quickly found that mornings were the best times to work. I was on-call for work so by the time it was the evening, my brain was fairly worn out. I’d wake up at 5 AM, run to my work computer and write the demos/slides until I had to leave.
Practice #1
The first time I gave this session was Wednesday, September 5th. I had volunteered to give the presentation for my team, to test what worked and what didn’t. I’m very grateful for their patience for this run, since it didn’t go smoothly. ZoomIt wasn’t zooming correctly on the second monitor and the presentation only lasted about 35 minutes. This was a big warning sign to me, that I needed to beef up the material to prepare for Friday.
Final prep
I spent the last couple days in a frenzy to complete the presentation. The hardest part of this was practicing the demos. I don’t mind practicing my presentation, but it can be pretty boring to run the same queries over and over and focusing on the same parts. When I practice talking through the presentation I don’t have a script, so I’ll change words between each practice.
Friday – the big day
It was finally Friday morning. I didn’t log into GroupBy or start up any distractions, I wanted to remain super focused on the goal. When I loaded into the conference and Brent started talking to me, I knew things were getting real. The first five minutes were scary. I have only done one remote presentation before, and it’s definitely a different type of challenge. Once I got into the flow of the presentation, I felt much more natural and the presentation flew by. Before I knew it, Daniel Hutmacher and I were talking about questions and the feedback in the SQL Community Slack Channel.
Post-session
I mentioned this during the presentation; the feedback I received from my session was incredible. I saw so many familiar names saying good things and I was riding the adrenaline from this presentation for another couple hours after my session. I’m incredibly grateful to hear the feedback. I want to thank several people who made this session and conference possibly.
Thank you
First, thank you Daniel for spending the time with me during my session, relaying questions and talking to me. It made it feel like a conversation. Second, thank you Brent Ozar for hosting the entire GroupBy event, for giving me feedback on this session abstract, and for taking the time to give me feedback after my session. Third, thank you to everyone who contributed to this session. My fellow DBA co-workers, Brian and Gerard, for sharing their thoughts and helping me pick the right terms. Finally, thank you to everyone who attended my session, either while it was running or afterwards. All of you have helped me give this session and it means the world to me.
Bert Wagner (blog) is hosting this month’s T-SQL Tuesday, and the topic is code that you’ve written that you’d hate to live without.
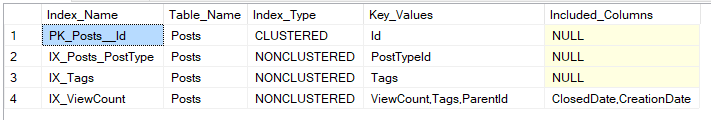
I’ve written scripts for myself that I keep in my folder of Toolbox scripts, so I had a few choices. I decided to deliver a script that I find myself using almost daily. This script was written to solve a specific problem: There’s no good way to display indexes and their columns, built into SQL Server.
You must be on SQL Server 2008 and above. Sorry, this script relies on the FOR XML PATH clause. You need access to the DMVs sys.indexes and sys.index_columns, and you must be using the right database context, i.e. USE [StackOverflow].
So why is this script so useful to me? Well, I deal with tables that have wide indexes with many columns. In the picture above, I’m looking at the IX_ViewCount index. If I queried just the DMVs without the extra formatting, there would be five rows, one for each column.
Limitations
I use this script for Clustered and Nonclustered indexes. I haven’t tested it with more complex index types, like Columnstore or In-Memory, so there could be limitations there. I also didn’t include index size in pages or bytes, but it wouldn’t be too difficult to add.
I’m happy to say this is my second T-SQL Tuesday post! The topic this week is looking forward to many years in the future, at T-SQL Tuesday #200, or blogging on a new feature that might come out on June 2026. Thanks to Adam Machanic for starting the T-SQL Tuesday idea and for the topic this week. His round-up post can be found here, or simply click the logo on the right side. The post below is the second option, I’ll be blogging on something that hasn’t happened. This post is all science fiction!
Query Optimizer on Github
Microsoft started to embrace open sourcing some of their applications way back in the 2010s. It took a while to get here, but finally the query optimizer has been open sourced. I’ve spent the past couple days immersed in the internals and I was surprised to find that Compatibility Mode 130 is still supported! If you enable trace flag 42, you can still run your SQL Server 2016 workloads on SQL Server 2024!
Reverting your Compatibility Level to 130
Ever since we’ve upgraded to SQL Server 2024, our queries just run slower so I’ve applied trace flag 42 to our production instances. I think I found the issue though. We were using the legacy Query Store which had forced plans, and the new 2024 Query Store is dynamically deciding which plans should be forced, at run time. With the changes I’m merging, we can exclude certain queries from the Query Store AI. At least these days, we get weekly cumulative updates, so we can just fix things in one week. It’s hard to believe, but we used to wait a month to apply a new SQL patch! And you had to reboot to apply changes! It all seems so draconian.
Query Store Internals: Indexes on the system views
Foreword
The Query Store is a great new feature available starting in SQL Server 2016. I started using it a few months ago, and learned a lot about it from Erin Stellato (blog | twitter)! I got a chance to speak with her at SQL Saturday Cleveland, where we discussed the indexes in this post. Thank you Erin for all your help with this post and understanding the Query Store! To anyone reading this post who wants to learn more, I highly recommend Erin’s blog posts and Pluralsight courses on Query Store.
Structure of the Query Store
The easiest way to see what’s stored in the Query Store is to query the catalog views. Behind the scenes of catalog views, data is stored in system tables . There are many benefits to this, starting with the fact that your performance data will survive a reboot. If we want to see these tables, we can search for them by looking for clustered indexes or heaps, that store this data. But when we query for these tables or their indexes, nothing shows up:
,COL_NAME(ic.object_id,ic.column_id) AS column_name
,ic.index_column_id
,ic.key_ordinal
,ic.is_included_column
FROM sys.indexes AS i
INNER JOIN sys.index_columns AS ic
ON i.object_id = ic.object_id AND i.index_id = ic.index_id
WHERE i.name like ‘%query_store%’
order by i.name
Another approach
Let’s try looking for just one view. Here’s a query store catalog view-:
sys.query_store_runtime_stats (and more from Microsoft)
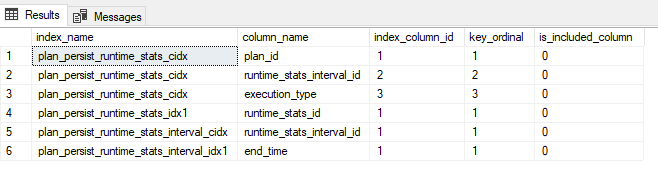
Same query, different keyword:
SELECT i.name AS index_name
,COL_NAME(ic.object_id,ic.column_id) AS column_name
,ic.index_column_id
,ic.key_ordinal
,ic.is_included_column
FROM sys.indexes AS i
INNER JOIN sys.index_columns AS ic
ON i.object_id = ic.object_id AND i.index_id = ic.index_id
WHERE i.name like ‘%runtime%’
order by i.name
Now we’re talking!
It looks like internally Query Store is referred to as plan_persist. That makes sense, thinking about how the Query Store persists query plans to your database’s storage. Let’s take a look at those catalog views vs their clustered and nonclustered indexes. I’ve modified the query a bit at this point, to group together the key columns.
SELECT i.name AS index_name ,
CASE when i.index_id = 1 THEN ‘Clustered’
WHEN i.index_id = 0 THEN ‘Heap’
ELSE ‘Nonclustered’ END as TypeOfIndex,
STUFF((
SELECT ‘,’ + COL_NAME(ic.object_id,ic.column_id)
FROM sys.index_columns as ic
WHERE i.object_id = ic.object_id AND i.index_id = ic.index_id
and is_included_column = 0 FOR XML PATH(”)),1,1,”)
Knowing this, we can query the Query Store using predicates supported by indexes! We can also see the Query Store indexes if we request actual Execution Plans.
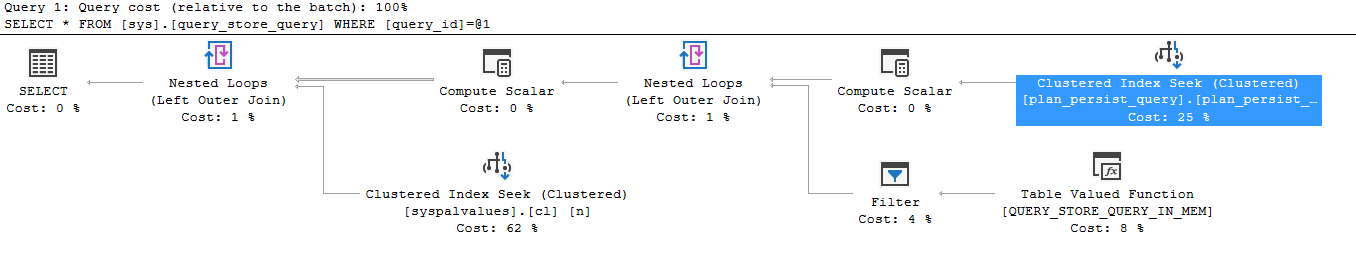
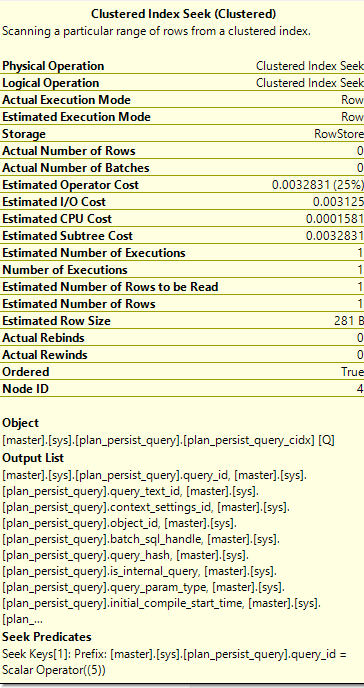
Here’s my query:
select * from sys.query_store_query
where query_id = 5
Here’s the execution plan:
And here’s the predicate that was applied:
Looking at this execution plan, the object is “plan_presist_query_cidx”, which is the index from above. This shows that Query Store uses these “plan persist” indexes, as the indexes behind the catalog views.
So what’s the point?
Well, Query Store size is user defined, so we can control how much space is consumed by the data in total. As our Query Store gets bigger, queries against the Query Store tables will start running slower unless we use the indexes properly. It’s important to know these indexes if you’re going to be querying Query Store regularly.
Final note (don’t do this in production)
As a cool side note, it’s possible to query the system tables directly if you’re connected to a SQL Server using the Dedicated Admin Connection (DAC). Please use only use the DAC on a test or local server for this example:
The connection prefix, “ADMIN:” shows that I’m connected with the DAC.
By continuing to use the site, you agree to the use of cookies. more information
The cookie settings on this website are set to "allow cookies" to give you the best browsing experience possible. If you continue to use this website without changing your cookie settings or you click "Accept" below then you are consenting to this.