Memory Grants part 3: How much memory can one query get?

Update 2019-03-25:

I recently learned that my testing in this post may have been incorrect. The formula is supposed to still be applied at 25%. I’ll be working on this page over the next few days to get more accurate testing.

When you build a brand new shiny SQL Server, you want to get a lot of memory so your queries run faster, right? More memory for your data pages in the buffer pool and more memory for all the queries that keep sorting data in the database instead of the application.

However, I was just talking with a consultant friend, and she says that some servers are still running on 16 GB of memory out in Prod! At least that means this demo will be relevant, since that’s how much my demo laptop has.

There’s a supposed to be a formula for max memory per query

Of course there’s a formula for it! I pulled the formula from the link, but when I started testing I saw different behavior on SQL Server 2016+. Let’s check the resource governor settings:

select * from sys.resource_governor_external_resource_pools

The formula in the link references 25%, but that was in an older version of SQL. I believe the formula on my SQL Server is

(Maximum SQL Server memory * 90%) * 20%

What fun would it be without a demo or two? Let’s dive right in. Here’s my current SQL Server settings.

Maximum server memory: 10 GB

So, on my machine, we’ll expect to get a max grant of (10 GB * .90) *.20 = 1.8 GB. Here’s my table for a big memory grant.

CREATE TABLE BigMemoryGrant (Id INT IDENTITY(1,1), column1 NVARCHAR(max));
GO

CREATE CLUSTERED INDEX cx_BigMemoryGrant on BigMemoryGrant(Id);
GO

INSERT INTO BigMemoryGrant
SELECT 'A'
FROM sys.messages

INSERT INTO BigMemoryGrant
SELECT 'B'
FROM sys.messages

INSERT INTO BigMemoryGrant
SELECT 'C'
FROM sys.messages

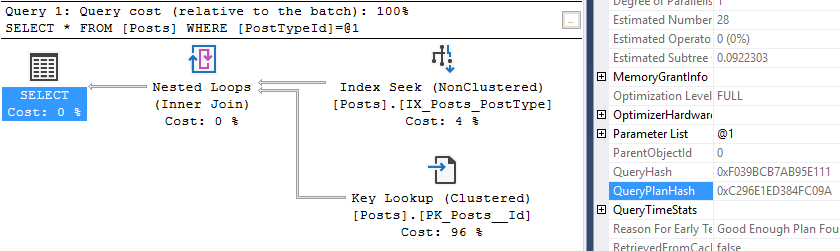
If you’re wondering why I picked nvarchar(max), check out the other posts in this series! Anyway, here’s our query to request a lot of memory.

SELECT * FROM BigMemoryGrant
ORDER BY column1
Max query memory: 1.8 GB or 1,827,560 KB

So we predicted 1.8 GB based on our formula, and we got a max grant just over 1.8 GB, that’s close enough for me!

I hope this was useful. If you add memory to your SQL Server, expect to see higher memory grants. Stay tuned!

When the query plan hash is deceptive

When you’re querying the plan cache, you need to know the four primary objects: the query hash, query plan hash, sql handle, and plan handle. However, the query plan hash recently surprised me.

Take a look at this index (in StackOverflow2010)

CREATE NONCLUSTERED INDEX [ix_Location_CreationDate] ON [dbo].[Users]
       ([Location] ASC,
	[CreationDate] ASC)
INCLUDE ( [Reputation])

Okay, we have a nonclustered index. Now I want a query that uses this index, but also does a key lookup to the clustered index, looking for the UpVotes column.

SELECT 
	Reputation
	,UpVotes
  FROM [StackOverflow2010].[dbo].[Users]
  WHERE Location = 'United States'
   and CreationDate >= '2009-05-01' 
   and CreationDate <= '2009-05-10'

Here’s the execution plan.

The query plan hash is 0xD30D4B58F7A1E0A8

Now, let’s change the UpVotes column to EmailHash

SELECT 
	Reputation
	,EmailHash
  FROM [StackOverflow2010].[dbo].[Users]
  WHERE Location = 'United States'
   and CreationDate >= '2009-05-01' 
   and CreationDate <= '2009-05-10'

The new query plan hash is 0xD30D4B58F7A1E0A8, exactly the same as the first plan hash.

Surprised?

I was surprised at first. I expected a different query plan hash because there was a different column being returned. I think it makes sense though. The query plan hash is supposed to represent the structure of the plan, and in both examples, it’s the same indexes used for the seek, key lookup, and nested loop operators.

One bonus example

What if we add the UpVotes column to the WHERE clause instead of the SELECT clause?

SELECT 
	Reputation
  FROM [StackOverflow2010].[dbo].[Users]
  WHERE Location = 'United States'
   and CreationDate >= '2009-05-01' 
   and CreationDate <= '2009-05-10'
   and UpVotes = 50
Query plan hash is 0xD30D4B58F7A1E0A8

That’s the same query plan hash, even when there’s a new predicate in the WHERE clause.

I hope this was interesting! If you take a look at the query hashes (apologies for the size of the screenshot), they changed for each different query. Stay tuned!

A brief introduction for bcp

I end up using the bcp utility to move tables between environments, and I’ve found that a lot of the guides on the internet go into great detail on how to use it. That’s fine if you have a lot of time. Here’s my brief introduction so that if I forget how to use it, I can reference this blog post.

Where to get bcp

It was already installed on this computer when I went to write this blog post, so I either installed it earlier or it comes with some of the SQL Server Management Studio tools. Either way, there’s a download at the link above.

What we need to know

Start up Command Prompt, probably as Administrator to be safe. Then run bcp to get some help information.

That’s a lot of parameters. Let’s talk about the ones we need.

-S "Server Name here"

-T OR -U and -P  
This is for authentication. -T for trusted, or Username and Password

-d "Database Name here"

-n Native type
Do this if you're importing back to SQL Server

Example time!

Let’s look at an example. Our test table is called Test.

bcp Test out "C:\Temp\TestTable.dat" -N -T -S "Server Name here\Named Instance here" -d "DBA"

We’re exporting the Test table to the C:\Temp folder, using Windows Authentication. We could replace the word “Test” with a query if we didn’t want to export the entire table.

Want to load data into SQL Server? Just change the “out” to “in.”

What about really big data? Well, the default batch size is 1000 rows. You can change this value when importing, but not when exporting. That’s a little confusing.

That’s all I have to say about bcp. I hope this is useful if you ever need to move simple data quickly. Stay tuned!

It’s always parameter sniffing (part 1?)

This is a blog post about a perennial issue. Have you ever had a call in the middle of the night about a slow webpage and you know nothing in the webpage changed?

Yeah, it’s probably parameter sniffing.

First, some clarification

All parameter sniffing is not bad. It’s usually a good thing, keeping our server’s CPU cores from wasting cycles on creating a new execution plan for each query. When SQL Server sees a query, it has to create a plan for the query it was given. It’s not the fault of your database that the old execution plan went away.

Is Parameter Sniffing causing my poor performance right now?

Oof, this is a tough question. Let’s talk about determining if parameter sniffing is occurring.

User A sends us the webpage that’s running slow and they send us the exact form that’s running slowly. We know from experience in our system that it’s the stored procedure, QueryPostType. Here’s the definition.

CREATE PROCEDURE [dbo].[QueryPostType] (@PostType INT) as
BEGIN

SELECT PostTypeId, Tags, Body 
FROM Posts 
WHERE PostTypeId = @PostType

END
GO

For the sake of setting expectations, we’re in the StackOverflow2010 database, and the Posts table is very skewed by PostTypeId.

Back to the example: The user has only given us the name of the procedure, and we’re playing detective. Let’s start by looking at the plan cache information on the procedure.

SELECT
    min_worker_time,
    max_worker_time,
    total_worker_time
FROM sys.dm_exec_procedure_stats
WHERE object_name(object_id) = 'QueryPostType'

This is the first warning sign

So the procedure stats for this query have incredibly different worker time values. That’s a good sign that something is wrong. The next step is to determine what parameters created this cached plan, then we’ll see if the other warning signs line up.

Parameter sniffing is complex enough that it might take a few more posts. Stay tuned!

SQL Server Monitoring: What to start measuring

So you’ve got a SQL Server that you want to monitor. What should you monitor? In my opinion, at bare minimum, you want to collect wait statistics. Let’s talk about a basic wait statistics collection.

Our new best friend: dm_os_wait_stats

This is the only place we need to query. It’s a DMV that shows the wait statistics for the entire instance since the instance rebooted.

Setting up a scheduled query to collect wait statistics

We need a table to store the wait statistics. Here’s a basic script for storing wait statistics. I added all the columns from the DMV above, along with a column for server name and the datetime when the data was inserted.

CREATE TABLE wait_statistics_history
    (wait_statistics_id BIGINT IDENTITY(1,1),
    wait_type NVARCHAR(60),
    waiting_tasks_count BIGINT,
    wait_time_ms BIGINT,
    max_wait_time_ms BIGINT,
    signal_wait_time_ms BIGINT,
    server_name NVARCHAR(128),
    insert_datetime DATETIME DEFAULT(GETDATE()))
    GO
CREATE CLUSTERED INDEX cx_wait_statistics_id on
   wait_statistics_history(wait_statistics_id);

And here’s a query to insert into that table.

INSERT INTO [dbo].[wait_statistics_history]
           ([wait_type]
           ,[waiting_tasks_count]
           ,[wait_time_ms]
           ,[max_wait_time_ms]
           ,[signal_wait_time_ms]
           ,[server_name]
          )
     SELECT
           wait_type
           ,waiting_tasks_count
           ,wait_time_ms
           ,max_wait_time_ms
           ,signal_wait_time_ms
           ,@@SERVERNAME
      FROM sys.dm_os_wait_stats

Okay, what now?

Now we have a way to track wait statistics over time. Feel free to wrap that query in a stored procedure, and execute from a SQL agent job. I’d recommend collecting once an hour, but you can always change that threshold.

Also, consider filtering out wait statistics that you don’t care about. There’s a lot of resources online for finding which wait statistics are good vs bad.

Thanks for reading! Stay tuned.

Execution plans: RetrievedFromCache

I first came across the value for RetrievedFromCache when I was reading a confusing execution plan. At first, I thought this could be really useful. If this value was true, you could assume that another query had compiled the execution plan that your query used and your query had retrieved that plan from the cache.

What I came to realize is that you can’t trust this value to be correct. Your database settings and type of query will change whether it’s true or not.

Here’s a couple tests that show how unpredictable this value is

I start each test by running DBCC FREEPROCCACHE to clear the plan cache on my test SQL Server. Don’t run this test in prod.

Starting the tests with an ad hoc SQL query.

SELECT PostTypeId, Tags,Body
 FROM Posts where PostTypeId = 3

Okay, this test looks good on the surface. There’s two more things you might be interested in. This query is not considered a trivial execution plan, but it did qualify for simple parameterization. Take a look at the circled parameter here.

Let’s add some complexity so that the value isn’t parameterized, again clearing the plan cache.

Now I’m just confused. The value 3 wasn’t parameterized, but evidently this query was retrieved from an empty plan cache? Let’s check the plan cache for that query hash and see what it has to say.

Looking into the plan cache

Hmmm. So at the very least, this RetrievedFromCache value is unreliable. If I had to guess, I’d say that this value is true if the plan can be stored in cache, not if it was retrieved. Maybe that’s just a slight typo?

I’d like to dig in more to what this value means but I don’t know where to start. I hope this post helps shed some light on where this value might be coming from.

Thanks for reading and stay tuned!

Why is the query hash so useful?

An example of how I use the query hash

I wrote a blog on what the query hash is, right here. That post describes the query hash, but it doesn’t help you if you’re looking at a slow query.

This post will try to answer that, in a few ways that you can use the query hash. Here’s our hypothetical scenario, which isn’t that far from reality.

Scene start: You log in for the day, and you have several alerts about your production server’s resource usage. It looks like something changed, but you don’t know what. Luckily, one of your fellow DBA teammates is already online and has identified the problematic query.

What users and servers are sending us this query?

The first question that we want to find out is what users are sending this query to our server, and what server they’re sending it from. Naturally, you ask your fellow DBA for the query text that they have. Instead, they tell you that they just have the execution plan.

Just ask for the query hash.

The execution plan has the query hash in the XML or in the graphical execution plan. Say that the other DBA sent you this hash, 0x90F7BA12EAE9502E. Let’s take a look at the queries we can use.

The first place: the plan cache

The plan cache is really useful in SQL Server, let’s use the query hash there. I think there’s a lot of excellent plan cache queries on the internet, so I’ll just write a really simple one for this demo.

SELECT    s.creation_time,
	  s.last_execution_time,
	  s.execution_count,
	  sql_text.text,
	  sql_plan.query_plan
FROM sys.dm_exec_query_stats as s 
CROSS APPLY sys.dm_exec_sql_text(s.sql_handle) as sql_text
CROSS APPLY sys.dm_exec_query_plan(s.plan_handle) as sql_plan
WHERE query_hash = 0x90F7BA12EAE9502E

That’s one way to look at it, and it gave us a lot of information on when the query ran! But I want to show you one more place where the query hash is useful: in currently running queries.

Finding currently running queries by query hash

Let’s find all the users and host servers that are currently running this query, and find the text that they input, using dm_exec_input_buffer.

SELECT s.host_name,
       s.login_name,
       input_buffer.event_info
FROM sys.dm_exec_sessions AS s
JOIN sys.dm_exec_requests AS r
    ON r.session_id = s.session_id
CROSS APPLY sys.dm_exec_input_buffer
    (s.session_id, r.request_id) as input_buffer
WHERE s.is_user_process = 1
    AND r.query_hash = 0x90F7BA12EAE9502E

So what do we do from here? Well, we have the query plan, we have the input text and we know the user who ran the query. That’s enough information to start investigating if there’s an issue in any of those places.

Thanks for reading, stay tuned!

Query memory grants part 2: Varchars and sorting

Why the heck did we make all our columns varchar? That’s a hypothetical question, please.

But now we have to pay for our decisions. Consider a query that has to do some sorting. Let’s make a table that needs some sorting.

The varchar sort

CREATE TABLE Names_Varchar
    (Id INT IDENTITY(1,1),
    Names VARCHAR(MAX) NOT NULL,
    SortValue int);

CREATE CLUSTERED INDEX cx_Names_Varchar on Names_Varchar(Id);

Add two scoops of data from StackOverflow 2010, and bake at 350 degrees for 30 minutes.

INSERT INTO Names_Varchar (Names)
SELECT DisplayName FROM StackOverflow2010.dbo.Users
--(299611 row(s) affected)

Sprinkle on some SortValues for flavor.

UPDATE Names_Varchar
SET SortValue = Id/100;

I’m doing this so I have some variations in SortValues per DisplayName. The names aren’t in any particular order, so this gives an element of randomness. Now we’re finally ready to sort and serve our query.

SELECT Names,SortValue FROM Names_Varchar
ORDER BY SortValue

Here’s your execution plan, as you requested.

That’s a lot of desired memory, 1,493,120 KB aka 1.4 GB, but there was only
25 MB used in the sort. So why was SQL Server so far off the right estimate? It’s the data types we picked.

Blaming the data types

What’s the biggest value in the Names column?

SELECT MAX(LEN(Names)) FROM Names_Varchar
--36

Let’s right size this and try again.

Names with varchar(100)

CREATE TABLE Names_Varchar_100
    (Id INT IDENTITY(1,1),
    Names varchar(100) NOT NULL,
    SortValue int);

CREATE CLUSTERED INDEX cx_Names_Varchar_100 on Names_Varchar_100(Id);

Load in the same data, etc.

INSERT INTO Names_Varchar_100(Names,SortValue)
SELECT Names, SortValue
FROM Names_Varchar

And send that sort off again, let’s see how much memory was granted.

Desired and Granted Memory are at 38 MB, and Used Memory is at 18 MB. That’s much closer.

Moral of the post

I don’t recommend blindly changing your varchar max values. I wanted to point out that there’s better ways to pick data types. The difference between max and 100 in this case was fairly dramatic, over 1 GB of memory extra.

Just make the right decision for your data types. Thanks for reading, stay tuned.

Basic PowerShell: Get-Member

Disclaimer: I’m still learning PowerShell. I’ve been using it more lately and I want to talk about it more. I’ll blog about the commands that I find useful.

Get-Member

Think of this command as the help button.

This is my current favorite command for troubleshooting an existing script. In PowerShell, you can “pipe” any object to this command and it will describe the properties and methods of that object.

Knowing the properties, you can then use Get-Member again to get the properties of those properties. That’s not confusing, right? Uhh, maybe a little. Let’s look at some examples.

I’m going to use the PowerShell ISE for this example. When you start PowerShell, it begins in the User directory.

Then I’ll run Get-ChildItem, which will get all the objects inside the current directory.

But what if I want to interact with those objects? I’ll need to know what their properties and methods are. That’s where Get-Member comes in!

Using the pipe to send the output to Get-Member

Simply send the output of any command to Get-Member.

Now we know all the details about that directory. Here’s the properties from further down the list, which shows some of the columns that were displayed when we ran Get-ChildItem.


Query plan hash

This is post 3 in the series about query fingerprints. Here’s the previous posts in this series:

What is it

A query plan hash is a hash made from the operations in a specific execution plan. I’d like to say that every single execution plan has a different hash, but there might be one or two hash collisions out there.

Inside the execution plan, the specific costs per operator, amount of memory, and other resources values can change without changing the query plan hash. I’ll demo that later in this post.

Let’s get right into the examples. First, the same query but different query plan hashes

Using the StackOverflow 2010 database, this is the same query from the query hash post, but I’m going to mix it up a little bit.

This query is a good example because the parameter of 3 will use a nonclustered index I created on PostTypeId. When I change the parameter to 1, the query will scan the Posts clustered index because there’s much more data for this parameter.

--PostTypeId 3 (Wiki posts in StackOverflow)
SELECT *
FROM Posts
WHERE PostTypeId = 3

Okay, our first query plan hash is 0xC296E1ED384FC09A, and the query hash is 0xF039BCB7AB95E111.

Now, I need a different execution plan, so I’ll change the value 3 to 1.

--PostTypeId 1 (Questions in StackOverflow)
SELECT *
FROM Posts
WHERE PostTypeId = 1

The query hash is the same, 0xF039BCB7AB95E111, but the execution plan is different. Now the query is just scanning the clustered index and the new query plan hash is 0x25255CFFBD7EC1FD.

What if we change the parameter but the execution plan is the same? Will the query plan hash change?

Here’s another parameter that will generate the same execution plan shape as the first query, but with different costs and values.

--PostTypeId 4 (TagWikiExerpt)
SELECT *
FROM Posts
WHERE PostTypeId = 4

So we have the same query hash as the other two examples, and the same query plan hash as the first example. This time, with a slightly higher costs on the key lookup.

The morale of using the query plan hash

Often, people will talk about finding a “bad plan” in cache when they’re looking at poor performance and suspect that it’s due to parameter sniffing.

Here’s my take: Since one query can have more than one query plan, there could be many plan hashes. Any type of index change can also influence what plan is chosen, and change the query plan hash.

My recommendations

I recommend tracking and collecting the most expensive queries in your plan cache over time, and as part of that strategy, monitor for new query plan hashes on existing queries.

Thanks for reading! Stay tuned for the last part in this series, plan handle.


By continuing to use the site, you agree to the use of cookies. more information

The cookie settings on this website are set to "allow cookies" to give you the best browsing experience possible. If you continue to use this website without changing your cookie settings or you click "Accept" below then you are consenting to this.

Close