Finding single use plans in the plan cache

A single use plan is an entry in the SQL Server plan cache that was only used once. When a query generates many similar entries in the plan cache, that query is using extra CPU to generate plans and wasting memory space to store them.

I’m going to focus on finding all single use plans in my plan cache. Then, in a later post, I’ll discuss how to reduce the number of plans.

We can find these plans by counting the number of entries in sys dm_exec_query_stats per query hash, where the plan has an execution count of 1.

Here’s a sample script:

SELECT query_hash,
COUNT(*) as number_of_entries
FROM sys.dm_exec_query_stats
WHERE execution_count = 1
GROUP BY query_hash
HAVING COUNT(*) > 1

Setting up single use plans

So I want a lot of single use plans. I wrote this SQL in StackOverflow2010 to generate a bunch of queries that will each take up one spot in the plan cache.

SELECT TOP 200 
N'EXEC(''SELECT Score FROM Posts AS p 
JOIN Users as u ON u.Id = p.OwnerUserId 
WHERE p.Id = ' + CAST(Id as nvarchar(200))  + ''')'
FROM Posts
ORDER BY Id

Running those queries on my test server, then running the script above it gives me this result:

So there’s 200 entries in the plan cache for this query. The plan cache can have up to 160,036 entries on 64-bit systems (source), so my test plan cache isn’t in any danger of running out of space.

Looking at the single use plans by query hash

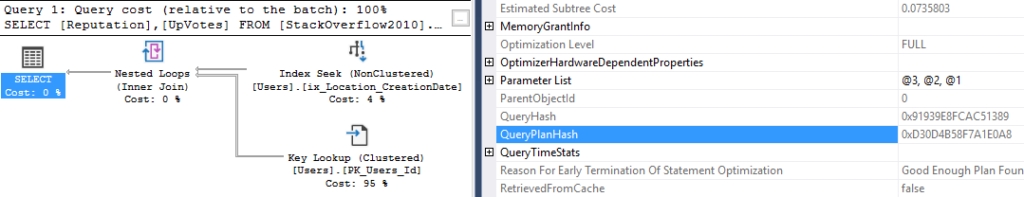
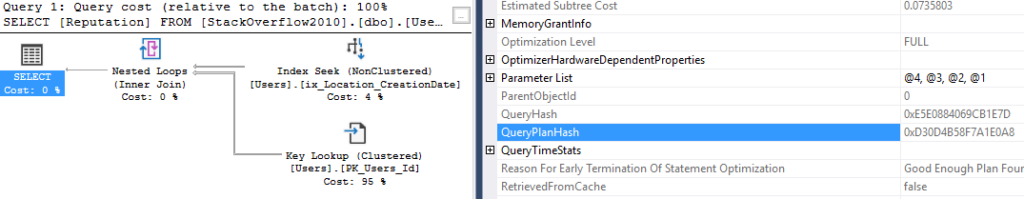
Now let’s take a look at one of those queries. Take the query_hash from above, or one in your environment, and take a look:

SELECT TOP 10 stext.text,
splan.query_plan
FROM sys.dm_exec_query_stats as stat
CROSS APPLY sys.dm_exec_sql_text(stat.sql_handle) as stext
CROSS APPLY sys.dm_exec_query_plan(stat.plan_handle) as splan
WHERE stat.query_hash = 0x5F56B6B5EC1A6A6F


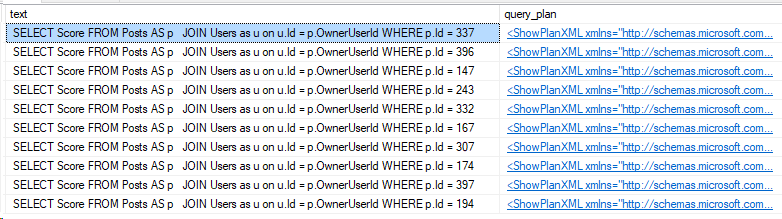
That’s just 10 of the 200 entries in my plan cache which are identical except for the value used in the WHERE clause.

In another post, I’ll tackle ways to handle these duplicates and reduce the number of single plans in cache. Stay tuned!

Performance on readable replicas in Availability Groups

I apologize in advance if I mess up the terminology.

I’ve worked with a moderate read workload on a readable replica and I wanted to share some of the things I’ve seen.

First, how in sync is your replica?

To make an Availability Group replica readable, you have to set to asynchronous commit. This means that you might be reading old data. I recommend creating a tracking table. I think a similar technique is sometimes used in replication.

Run an Agent job on the primary replica that inserts a date every 5-10 seconds, and then make sure it stays up to date. While you can achieve a similar effect with PerfMon counters and monitoring scripts, you want a table like this so that your applications can see how up-to-date their data is. Here’s a simple example.

CREATE TABLE LatestDate (LogDate datetime2)
GO
CREATE CLUSTERED INDEX cx_LogDate on LatestDate(LogDate)
GO

--Run the below script as frequently as your environment demands.
INSERT INTO LatestDate (LogDate)
SELECT GETDATE()

What about query performance?

If you heavily use readable secondaries, you need to monitor the performance over there. Not just the CPU, memory and plan cache, but also the index usage and missing index DMVs. Here’s a script you can split into two parts to capture the missing index requests, I don’t have a script for index usage on my blog yet.

Isolation level on your replica (+ TempDB usage increase)

There’s also a couple more caveats here. First, the isolation level changes on readable replicas.

” All queries that run against the secondary databases are automatically mapped to snapshot isolation transaction level, even when other transaction isolation levels are explicitly set. ” Source

That means all the NOLOCK hints don’t do anything. That doesn’t mean there will be blocking, the snapshot isolation level should prevent that. But it does mean more TempDB usage in terms of the version store. Check out the dm_tran_version_store_usage .

One more thing

There’s probably a lot more that can be written on this subject. I want to conclude by saying I still think that readable replicas are very useful, and provide a list of a few closed bugs from recent SQL Server updates:

Thanks for reading! Stay tuned.

Bad indexing can show up in wait statistics

At first, this statement might sound a bit confusing. Usually, we expect wait statistics to show us what a query is waiting on, whether it’s waiting on memory, loading pages from disk, or any of the other numerous wait types.

Once you start collecting wait statistics, you’ll have a lot of data to sort through. You might find waits like CX_PACKET, CX_CONSUMER, and PAGEIOLATCH. Surprisingly, these could mean that your databases aren’t well indexed.

Let’s take a look at an example in StackOverflow2010

For the sake of this post, pretend that this query is mission critical, and we need to diagnose why it’s running slow and fix it by any means possible.

SELECT p.Score, p.CommentCount 
FROM Posts as p
WHERE p.LastEditorDisplayName ='arthurd'
--0 rows returned, took 38 seconds

Here’s the actual execution plan.

For now, let’s ignore the missing index request. Missing indexes are unreliable. Let’s start by using sp_WhoIsActive while the query runs, and see what it says.

Click the image for details.

Hmm, it shows the wait type of CX_CONSUMER. This is a parallelism wait, let’s try the query again with OPTION (MAXDOP 1).

Trying the query with no parallelism

SELECT p.Score, p.CommentCount 
FROM Posts as p
WHERE p.LastEditorDisplayName ='arthurd'
OPTION (MAXDOP 1)
--0 rows returned, 1 minute 30 seconds duration

Here’s another capture of sp_WhoIsActive, this time with only one core so there’s no parallelism.

Click the image for details.

Oh now we have another wait. This time, it’s PAGEIOLATCH_SH. That’s an IO wait, SQL Server is having to retrieve the data pages from disk. But wait, we haven’t even considered that we could index this problem.

Finding a solution without calling the SAN admin

Check the indexes on the table with your favorite script. I’ll pick sp_BlitzIndex

exec sp_blitzindex @DatabaseName = 'StackOverflow2010',
 @SchemaName = 'dbo', @TableName = 'Posts'

So there’s no nonclustered indexes on this table. The top index, PK_Posts_Id is the clustered index and it’s being scanned each time. Let’s create a covering index for our mission critical query.

CREATE NONCLUSTERED INDEX ix_LastEditorDisplayName 
ON Posts(LastEditorDisplayName)
INCLUDE (Score, CommentCount)

And now we re-run our query, no MAXDOP hint.

set statistics time on;
SELECT p.Score, p.CommentCount 
FROM Posts as p
WHERE p.LastEditorDisplayName ='arthurd'
--7 milliseconds

Now the query runs quickly! No wait statistics to be found.

Moral of the post

I don’t want people who read this post to think that I’m a proponent of creating indexes for every single slow query. I also don’t want to leave the impression that wait statistics always mean there’s issues with queries.

However, in some cases, the wait statistics can be a symptom of broader issues with poorly written queries, lack of indexing strategy, and other performance problems. I still recommend starting with wait statistics, then work your way through your environment to see if the database is designed properly and tuned.

Stay tuned!

Two T-SQL features that I appreciate

We occasionally get cool improvements in T-SQL in newer versions of SQL Server. Here’s a short post on some of the improvements that I like a lot.

DROP [x] IF EXISTS

Introduced in SQL Server 2016.

When I first saw this command, I was like, awesome! This makes deploy scripts or scripts with temp tables easier.

Now queries with temp tables are super easy to write. Just write, for example:

DROP TABLE IF EXISTS #test_table

SELECT *
into #test_table
FROM sys.dm_exec_requests

Boom! The query is instantly re-runnable without a DROP TABLE command at the very end of the statement. Here’s the results on my test machine, and I can run this query over and over without it failing.

But wait, there’s more. What if you wanted to create a nonclustered index with the same idea? (Keep in mind that dropping an index can be a blocking operation)

DROP INDEX IF EXISTS ix_test1 ON Posts

CREATE NONCLUSTERED INDEX ix_test1 ON Posts(OwnerUserId)  

Again, you get the same result every time you run:

CREATE OR ALTER [x]

This feature is available in SQL Server 2016 SP1 and above.

This is possibly the most useful addition for code deploys. Instead of having to check if the object exists in your code deployer logic, just use create or alter like so:

CREATE OR ALTER PROCEDURE sp_Test as
BEGIN
SELECT 1
END
GO

Every time you run this code, it completes successfully.

I’m using create or alter often, it just makes life easier. Stay tuned!

Index maintenance freebies

I didn’t expect anything for free in index maintenance. After all, it takes a lot of CPU and transaction log space to remove fragmentation.

Let’s talk about two things that SQL Server does for us: one statistic is created per index we create, and when we rebuild that index, we get fresh statistics. We can also update statistics with full scan on our own, without needing to rebuild the index.

For all the time we spend rebuilding our indexes, often the big performance gain we get is from the fresh statistics and those statistics are made with full scan.

Let’s get some proof

Using StackOverflow2010, here’s my index.

CREATE NONCLUSTERED INDEX ix_Location_CreationDate ON dbo.Users
(Location, CreationDate)
INCLUDE (Reputation);
GO

Now, let’s update the statistics with the automatic sample size.

UPDATE STATISTICS Users (ix_Location_CreationDate);
Statistics details in SSMS

I say that index needs to be rebuilt, at least for the purposes of this demo.

ALTER INDEX ix_Location_CreationDate ON dbo.Users REBUILD;

Now taking a second look at the statistics:

Moral of the post

Statistics are automatically updated with the default sample size when a certain amount of data changes. I won’t talk about what that certain amount is, because it changes in major versions of SQL Server. What that means to us is that data changes can occasionally change statistics, which can mean worse performance.

Then, when the index maintenance jobs run and rebuild the indexes, the statistics get a full sample of the data. This means that your performance might improve from fresh statistics alone.

Stay tuned!

When the query plan hash is deceptive

When you’re querying the plan cache, you need to know the four primary objects: the query hash, query plan hash, sql handle, and plan handle. However, the query plan hash recently surprised me.

Take a look at this index (in StackOverflow2010)

CREATE NONCLUSTERED INDEX [ix_Location_CreationDate] ON [dbo].[Users]
       ([Location] ASC,
	[CreationDate] ASC)
INCLUDE ( [Reputation])

Okay, we have a nonclustered index. Now I want a query that uses this index, but also does a key lookup to the clustered index, looking for the UpVotes column.

SELECT 
	Reputation
	,UpVotes
  FROM [StackOverflow2010].[dbo].[Users]
  WHERE Location = 'United States'
   and CreationDate >= '2009-05-01' 
   and CreationDate <= '2009-05-10'

Here’s the execution plan.

The query plan hash is 0xD30D4B58F7A1E0A8

Now, let’s change the UpVotes column to EmailHash

SELECT 
	Reputation
	,EmailHash
  FROM [StackOverflow2010].[dbo].[Users]
  WHERE Location = 'United States'
   and CreationDate >= '2009-05-01' 
   and CreationDate <= '2009-05-10'

The new query plan hash is 0xD30D4B58F7A1E0A8, exactly the same as the first plan hash.

Surprised?

I was surprised at first. I expected a different query plan hash because there was a different column being returned. I think it makes sense though. The query plan hash is supposed to represent the structure of the plan, and in both examples, it’s the same indexes used for the seek, key lookup, and nested loop operators.

One bonus example

What if we add the UpVotes column to the WHERE clause instead of the SELECT clause?

SELECT 
	Reputation
  FROM [StackOverflow2010].[dbo].[Users]
  WHERE Location = 'United States'
   and CreationDate >= '2009-05-01' 
   and CreationDate <= '2009-05-10'
   and UpVotes = 50
Query plan hash is 0xD30D4B58F7A1E0A8

That’s the same query plan hash, even when there’s a new predicate in the WHERE clause.

I hope this was interesting! If you take a look at the query hashes (apologies for the size of the screenshot), they changed for each different query. Stay tuned!

A brief introduction for bcp

I end up using the bcp utility to move tables between environments, and I’ve found that a lot of the guides on the internet go into great detail on how to use it. That’s fine if you have a lot of time. Here’s my brief introduction so that if I forget how to use it, I can reference this blog post.

Where to get bcp

It was already installed on this computer when I went to write this blog post, so I either installed it earlier or it comes with some of the SQL Server Management Studio tools. Either way, there’s a download at the link above.

What we need to know

Start up Command Prompt, probably as Administrator to be safe. Then run bcp to get some help information.

That’s a lot of parameters. Let’s talk about the ones we need.

-S "Server Name here"

-T OR -U and -P  
This is for authentication. -T for trusted, or Username and Password

-d "Database Name here"

-n Native type
Do this if you're importing back to SQL Server

Example time!

Let’s look at an example. Our test table is called Test.

bcp Test out "C:\Temp\TestTable.dat" -N -T -S "Server Name here\Named Instance here" -d "DBA"

We’re exporting the Test table to the C:\Temp folder, using Windows Authentication. We could replace the word “Test” with a query if we didn’t want to export the entire table.

Want to load data into SQL Server? Just change the “out” to “in.”

What about really big data? Well, the default batch size is 1000 rows. You can change this value when importing, but not when exporting. That’s a little confusing.

That’s all I have to say about bcp. I hope this is useful if you ever need to move simple data quickly. Stay tuned!

Why is the query hash so useful?

An example of how I use the query hash

I wrote a blog on what the query hash is, right here. That post describes the query hash, but it doesn’t help you if you’re looking at a slow query.

This post will try to answer that, in a few ways that you can use the query hash. Here’s our hypothetical scenario, which isn’t that far from reality.

Scene start: You log in for the day, and you have several alerts about your production server’s resource usage. It looks like something changed, but you don’t know what. Luckily, one of your fellow DBA teammates is already online and has identified the problematic query.

What users and servers are sending us this query?

The first question that we want to find out is what users are sending this query to our server, and what server they’re sending it from. Naturally, you ask your fellow DBA for the query text that they have. Instead, they tell you that they just have the execution plan.

Just ask for the query hash.

The execution plan has the query hash in the XML or in the graphical execution plan. Say that the other DBA sent you this hash, 0x90F7BA12EAE9502E. Let’s take a look at the queries we can use.

The first place: the plan cache

The plan cache is really useful in SQL Server, let’s use the query hash there. I think there’s a lot of excellent plan cache queries on the internet, so I’ll just write a really simple one for this demo.

SELECT    s.creation_time,
	  s.last_execution_time,
	  s.execution_count,
	  sql_text.text,
	  sql_plan.query_plan
FROM sys.dm_exec_query_stats as s 
CROSS APPLY sys.dm_exec_sql_text(s.sql_handle) as sql_text
CROSS APPLY sys.dm_exec_query_plan(s.plan_handle) as sql_plan
WHERE query_hash = 0x90F7BA12EAE9502E

That’s one way to look at it, and it gave us a lot of information on when the query ran! But I want to show you one more place where the query hash is useful: in currently running queries.

Finding currently running queries by query hash

Let’s find all the users and host servers that are currently running this query, and find the text that they input, using dm_exec_input_buffer.

SELECT s.host_name,
       s.login_name,
       input_buffer.event_info
FROM sys.dm_exec_sessions AS s
JOIN sys.dm_exec_requests AS r
    ON r.session_id = s.session_id
CROSS APPLY sys.dm_exec_input_buffer
    (s.session_id, r.request_id) as input_buffer
WHERE s.is_user_process = 1
    AND r.query_hash = 0x90F7BA12EAE9502E

So what do we do from here? Well, we have the query plan, we have the input text and we know the user who ran the query. That’s enough information to start investigating if there’s an issue in any of those places.

Thanks for reading, stay tuned!

Query plan hash

This is post 3 in the series about query fingerprints. Here’s the previous posts in this series:

What is it

A query plan hash is a hash made from the operations in a specific execution plan. I’d like to say that every single execution plan has a different hash, but there might be one or two hash collisions out there.

Inside the execution plan, the specific costs per operator, amount of memory, and other resources values can change without changing the query plan hash. I’ll demo that later in this post.

Let’s get right into the examples. First, the same query but different query plan hashes

Using the StackOverflow 2010 database, this is the same query from the query hash post, but I’m going to mix it up a little bit.

This query is a good example because the parameter of 3 will use a nonclustered index I created on PostTypeId. When I change the parameter to 1, the query will scan the Posts clustered index because there’s much more data for this parameter.

--PostTypeId 3 (Wiki posts in StackOverflow)
SELECT *
FROM Posts
WHERE PostTypeId = 3

Okay, our first query plan hash is 0xC296E1ED384FC09A, and the query hash is 0xF039BCB7AB95E111.

Now, I need a different execution plan, so I’ll change the value 3 to 1.

--PostTypeId 1 (Questions in StackOverflow)
SELECT *
FROM Posts
WHERE PostTypeId = 1

The query hash is the same, 0xF039BCB7AB95E111, but the execution plan is different. Now the query is just scanning the clustered index and the new query plan hash is 0x25255CFFBD7EC1FD.

What if we change the parameter but the execution plan is the same? Will the query plan hash change?

Here’s another parameter that will generate the same execution plan shape as the first query, but with different costs and values.

--PostTypeId 4 (TagWikiExerpt)
SELECT *
FROM Posts
WHERE PostTypeId = 4

So we have the same query hash as the other two examples, and the same query plan hash as the first example. This time, with a slightly higher costs on the key lookup.

The morale of using the query plan hash

Often, people will talk about finding a “bad plan” in cache when they’re looking at poor performance and suspect that it’s due to parameter sniffing.

Here’s my take: Since one query can have more than one query plan, there could be many plan hashes. Any type of index change can also influence what plan is chosen, and change the query plan hash.

My recommendations

I recommend tracking and collecting the most expensive queries in your plan cache over time, and as part of that strategy, monitor for new query plan hashes on existing queries.

Thanks for reading! Stay tuned for the last part in this series, plan handle.


By continuing to use the site, you agree to the use of cookies. more information

The cookie settings on this website are set to "allow cookies" to give you the best browsing experience possible. If you continue to use this website without changing your cookie settings or you click "Accept" below then you are consenting to this.

Close