We converted an ad-hoc query into a prepared query using sp_executesql. Then, a user called in reporting slowness. When we run the query in Management Studio, the query runs quickly. We checked our SET options with the application and they’re matching.
What could be causing the difference?
Well, it could be the line endings in our version of the query. If the query we’re running in Management Studio has different text or line endings, we might not be retrieving the right query from cache to correctly reproduce the parameter sniffing issues.
First, the query in cache
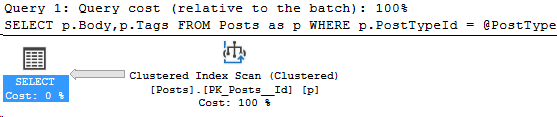
Let’s take a look at the query that’s causing issues in the plan cache.
USE StackOverflow2010
GO
EXEC sp_executesql N'
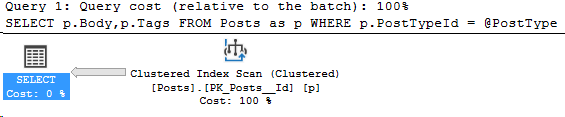
SELECT p.Body,p.Tags
FROM Posts as p
WHERE p.PostTypeId = @PostType',
N'@PostType INT', '1'
Here’s the execution plan for that query:
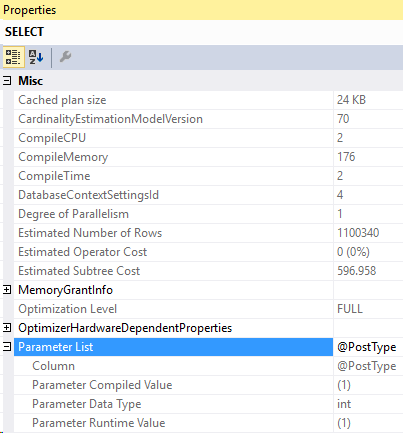
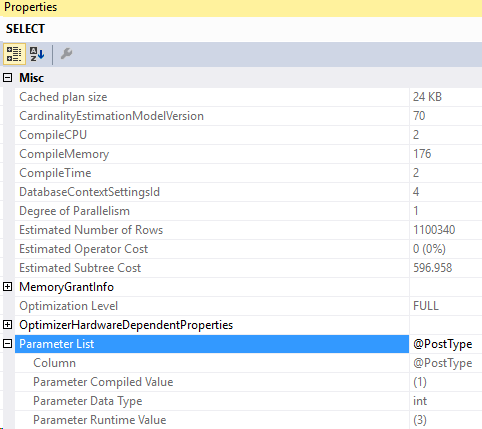
And the compiled parameters:
Second, the query we’re running locally
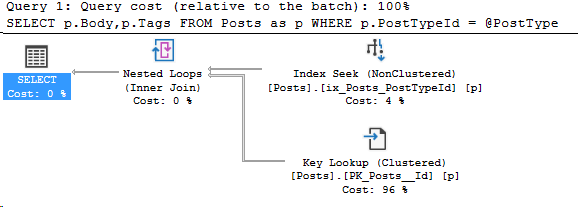
When we run our query locally, we get a different plan. We are using a different parameter, but that’s not the critical difference. The difference in this query is the spacing.
USE StackOverflow2010
GO

EXEC sp_executesql N'
SELECT p.Body,p.Tags
FROM Posts as p WHERE p.PostTypeId = @PostType',
N'@PostType INT', '3'
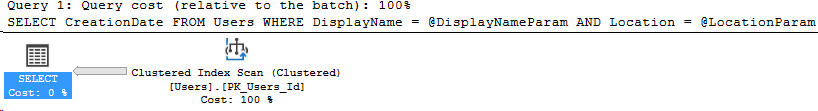
I specifically changed the spacing on line 6-7 to show that now I’m getting a different plan. Here’s the new plan I get:
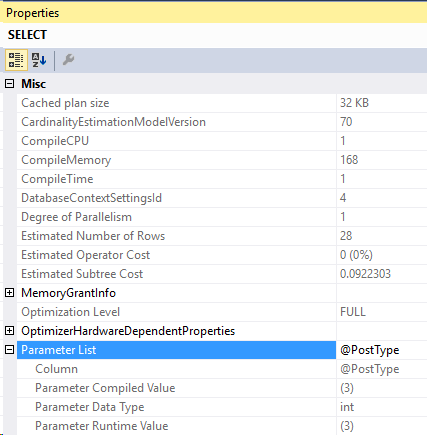
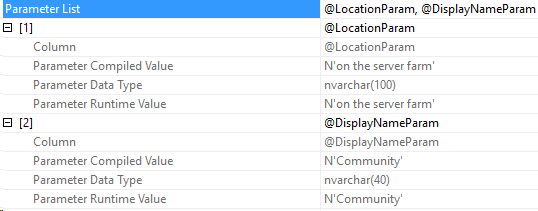
And the new compiled parameters:
So how do we find the correct formatting, so we can retrieve the compiled plan from the first query?
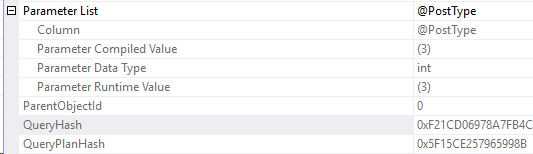
Well, our first step is to go check the plan cache to see if we have the right query hash, and sql handle. Use the second execution plan’s properties to find those values.
They’re right below the parameter list:
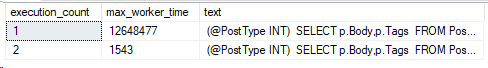
Now, we query the plan cache for that query hash and use the DMV, sys.dm_exec_sql_text.
SELECT execution_count,max_worker_time,sText.text
FROM sys.dm_exec_query_stats as s
CROSS APPLY sys.dm_exec_sql_text(s.sql_handle) as sText
WHERE s.query_hash = 0xF21CD06978A7FB4C
One of these is the problematic query, that’s for sure!
Side note: Turning on CR/LF
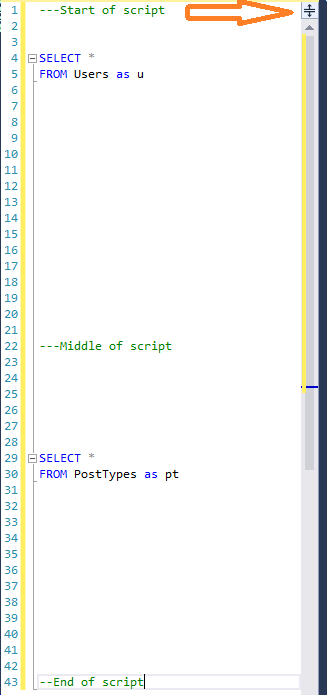
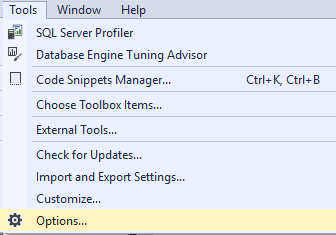
Now, for this next step, you’ll need to setup your Management Studio to retain CR/LF (Carriage Return and Line Feed). Find that option under Tools->Options
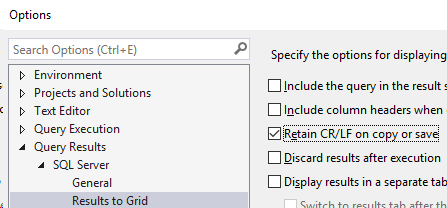
Then under Results to Grid, check this box for Retain CR/LF. Once you do this, you’ll need to open a new tab or restart your Management Studio for it to take effect.
Back to the plan cache
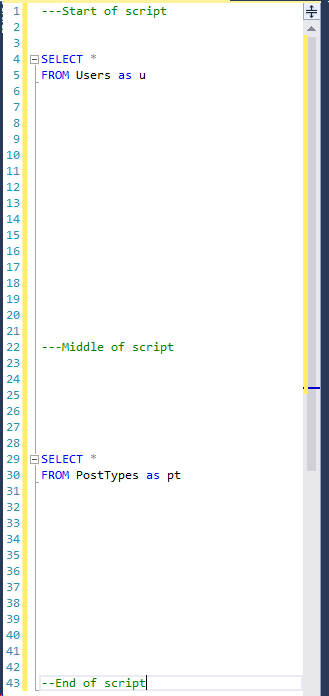
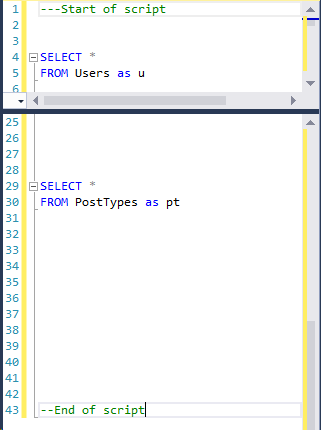
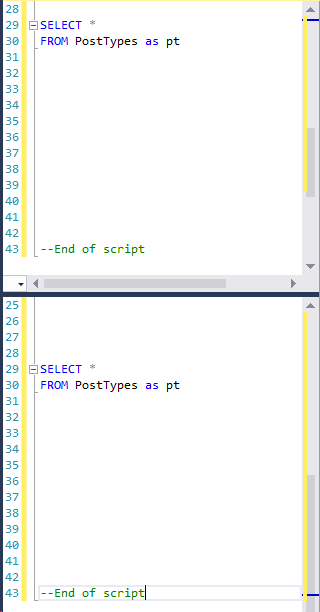
Let’s copy the text out from this query result. I copied both results into new windows, here’s a side-by-side.
Now, I mentioned earlier changing this specifically. But if I saw this while troubleshooting parameter sniffing, this would be a big sign that the two queries had different formatting.
If we have access to the application codebase, we can ask for the full query with formatting included. Otherwise, this crude but effective comparison showed us that we need to change formatting.
Applying the change and demonstrating the query slow in Management Studio
Here’s our PostType 3 query with the correct formatting.
USE StackOverflow2010
GO

EXEC sp_executesql N'
SELECT p.Body,p.Tags
FROM Posts as p
WHERE p.PostTypeId = @PostType',
N'@PostType INT', '3'
And this time, the compiled value is 1 but the actual runtime parameter is 3. We retrieved the bad plan from cache!
After thoughts
This example is extremely straightforward. I didn’t add any special formatting or white space beyond an extra line. Issues like this can get much more complicated, quickly.
When troubleshooting parameter sniffing issues, having the query version from the application is going to be better than trying to reverse engineer it from the plan cache like this example.
However, the plan cache can be used to determine if there’s a difference, when combined with comparison tools like Notepad++‘s Compare functionality. There’s definitely room for another blog post on that.
I wanted to write this post to show that small differences in text can make the difference when it comes to reproducing a parameter sniffing issue.
Last week I talked about single use plans. One way to increase execution plan re-use is to parameterize queries by wrapping them in sp_executesql.
I’ve started using this stored procedure enough that I wanted to write a short guide on converting a query into sp_executesql.
Our query before sp_executesql
SELECT CreationDate
FROM Users
WHERE DisplayName = N'Community'
AND Location = N'on the server farm'
So there’s two values in the WHERE clause that could change between queries, if we want to look for a different DisplayName or Location. Let’s parameterize those in sp_executesql.
EXEC sp_executesql N'
SELECT CreationDate
FROM Users
WHERE DisplayName = @DisplayNameParam
AND Location = @LocationParam'
That’s a good start, but now we need to tell the server what our parameters are. Add a comma, and add those after the first string like this:
EXEC sp_executesql N'
SELECT CreationDate
FROM Users
WHERE DisplayName = @DisplayNameParam
AND Location = @Location',
N'@DisplayNameParam NVARCHAR(40), @LocationParam NVARCHAR(100)'
Completing the example of sp_executesql
And finally, we need another two commas. This is the part where we add the values for the parameters, in the same order that we declared them. That means DisplayNameParam first, then LocationParam second.
EXEC sp_executesql N'
SELECT CreationDate
FROM Users
WHERE DisplayName = @DisplayNameParam
AND Location = @Location',
N'@DisplayNameParam NVARCHAR(40), @Location NVARCHAR(100)',
N'Community', N'on the server farm'
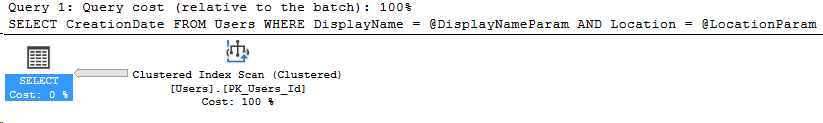
Perfect! Here’s the execution plan and the parameter list from the SELECT operator.
Changing the values to prove the execution plan will be re-used
Let’s look for a user that doesn’t exist. Here’s some parameters that won’t match any rows in StackOverflow2010.
EXEC sp_executesql N'
SELECT CreationDate
FROM Users
WHERE DisplayName = @DisplayNameParam
AND Location = @LocationParam',
N'@DisplayNameParam NVARCHAR(40), @LocationParam NVARCHAR(100)',
N'Not a real user', N'No location'
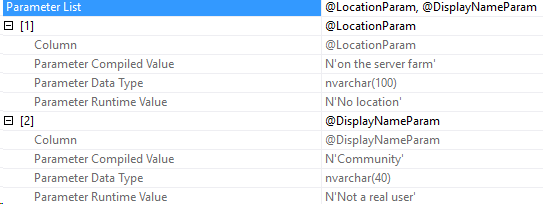
Here’s the same execution plan and parameter list. The compiled values are Community and on the server farm, showing that the first plan was re-used.
That’s it for an introduction to sp_executesql. You can add more parameters, I just chose to use two for this demo.
To add onto yesterday’s post about which cardinality estimator (CE) your query will use, there’s an additional complexity. This specifically applies to cross database queries.
The database context in which you run the query will determine which CE is used. Let’s look at an example.
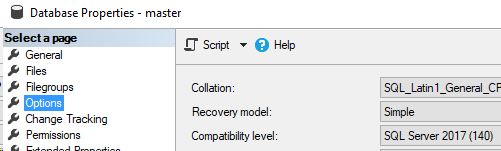
First, check on the master and StackOverflow2010 compatibility levels
Querying a 3-part name: StackOverflow2010.dbo.Users
USE [StackOverflow2010]
GO
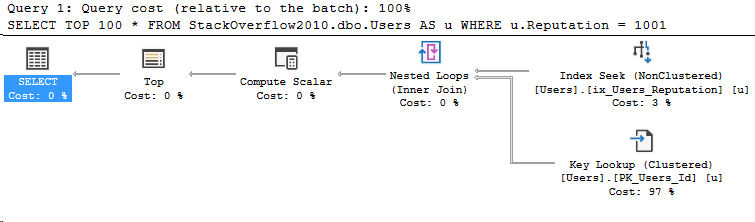
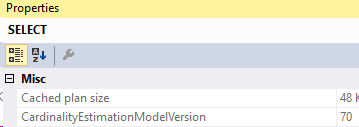
SELECT TOP 100 *
FROM StackOverflow2010.dbo.Users AS u
WHERE u.Reputation = 1001
This is our baseline query from yesterday. As expected, when we look in the properties of the SELECT operator in the execution plan, we’ll see CE version 70.
Changing database context to master
In this example, I’ll use the master database but it could be any other database.
USE [master]
GO
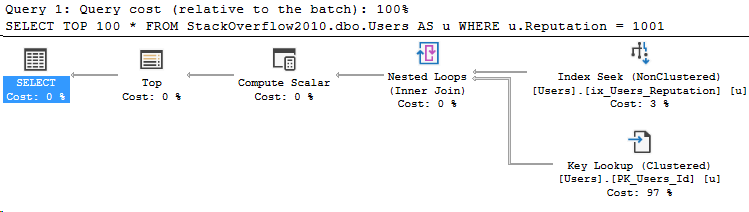
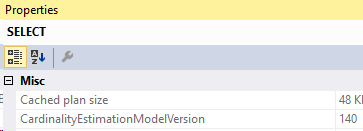
SELECT TOP 100 *
FROM StackOverflow2010.dbo.Users AS u
WHERE u.Reputation = 1001
So, now that we’re running in master, we used CE version 140. Now in this execution plan, it didn’t make a difference which CE was used. I apologize for not having a good demo of that yet.
I hope this helps when looking at upgrading compatibility levels. The CE version will change based on what database context was used.
SQL Server 2008 is reaching end of support this year, so upgrading your SQL Server might be on your mind. One of the big changes when you upgrade your SQL Servers is upgrading the compatibility level, which by default will upgrade the cardinality estimator (CE).
This can change query performance, for better or for worse. This post won’t focus on whether it’s good or bad, but instead I want to show you how you can check to see what CE was used by your queries.
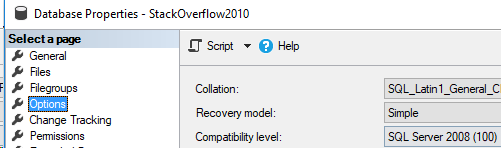
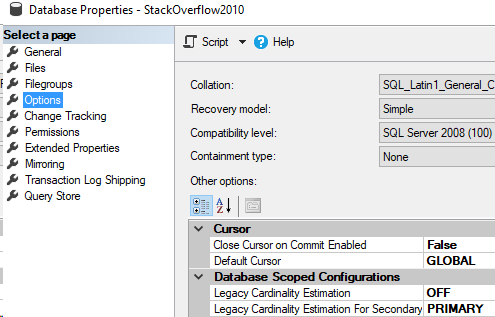
Let’s look at a database in 2008 compatibility level
Here’s our database properties.
This is similar to a database restored fresh from 2008 onto a 2017 server. Now, let’s run our query and see what CE will be used.
USE [StackOverflow2010]
GO
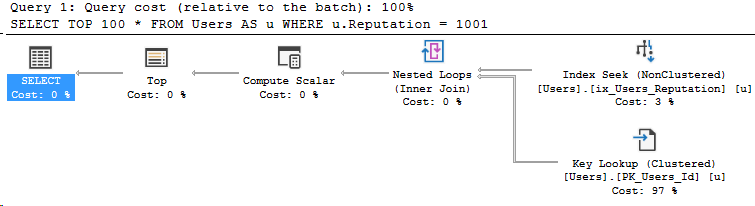
SELECT TOP 100 *
FROM Users AS u
WHERE u.Reputation = 1001
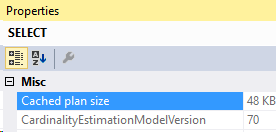
Looking at the properties of the SELECT operator.
So the old cardinality estimator is version 70. Let’s upgrade the compatibility level to SQL Server 2017.
ALTER DATABASE [StackOverflow2010] SET COMPATIBILITY_LEVEL = 140
GO
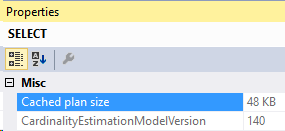
Re-running our query:
So this query is using the 2017 CE. There’s two more versions available in SQL Server 2017: 120 and 130, which are accessible with compatibility level 120 and 130 respectively.
That brings us a total of four different versions: 70, 120, 130 and 140.
Compatibility level (and therefore, cardinality estimator level) can change your execution plans
I didn’t show any examples in this post because the execution plan stayed the same, but changing the database compatibility level can dramatically change execution plans. That’d be a good topic for a future post!
Happy Friday! We made it. Here’s something I came across while testing optimize for ad hoc for this week’s blog posts.
First, the (better) way to use sp_executesql
The rest of this post will be using ad hoc queries with optimize for ad hoc ON at the several level. But first, take a look at using a parameter inside sp_executesql and what it shows inside the plan cache.
I want to say that this is not the best way to use sp_executesql. Here’s my query and how I could properly wrap it in sp_executesql.
--Here's the ad hoc version
SELECT Score FROM Posts AS p
JOIN Users as u ON u.Id = p.OwnerUserId
WHERE p.Id = 13
GO
--And here's it wrapped it in sp_executesql
--with a variable, @PostId instead of the literal, 13
EXEC sp_executesql N'SELECT Score FROM Posts AS p
JOIN Users as u ON u.Id = p.OwnerUserId
WHERE p.Id = @PostId', N'@PostId int', '13'
GO
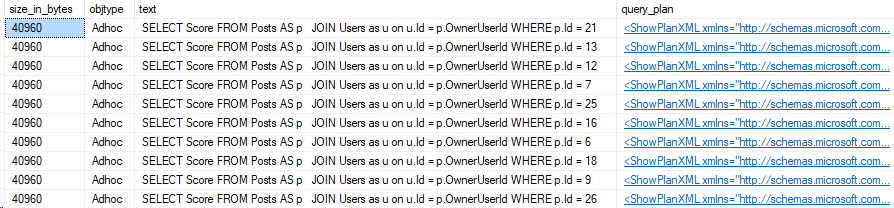
And here’s the plan cache after running those two queries, with optimize for ad hoc on.
SELECT TOP 10
cache.size_in_bytes,
cache.objtype,
stat.execution_count,
stext.text,
splan.query_plan
FROM sys.dm_exec_query_stats as stat
CROSS APPLY sys.dm_exec_sql_text(stat.sql_handle) as stext
CROSS APPLY sys.dm_exec_query_plan(stat.plan_handle) as splan
JOIN sys.dm_exec_cached_plans as cache on cache.plan_handle = stat.plan_handle
Okay, so this is as expected. The Adhoc query didn’t save the execution plan into cache, and the size is a lot smaller. But what if we didn’t replace 13 with the variable @PostId?
Leaving things as they are
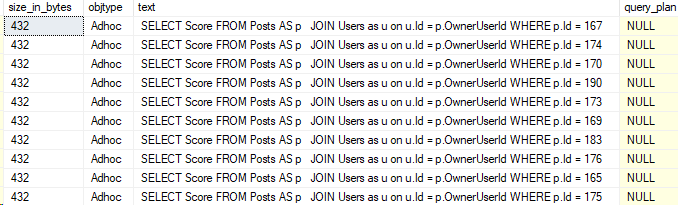
Sometimes, we don’t have time to change the code. Sometimes the code is still using literals inside sp_executesql, essentially running ad hoc statements. Let’s take a look at that scenario.
--ad hoc version
SELECT Score FROM Posts AS p
JOIN Users as u ON u.Id = p.OwnerUserId
WHERE p.Id = 13
GO


EXEC sp_executesql N'SELECT Score FROM Posts AS p
JOIN Users as u ON u.Id = p.OwnerUserId
WHERE p.Id = 13'
GO
Here’s the results of our plan cache query.
Changing the order of statement – sp_executesql first
Now, you might wonder what happens if we change the order of the statements. Since I ran the sp_executesql as the second statement, maybe it cached that plan. Let’s run the sp_executefirst.
EXEC sp_executesql N'SELECT Score FROM Posts AS p
JOIN Users as u ON u.Id = p.OwnerUserId
WHERE p.Id = 13'
GO

--ad hoc version
SELECT Score FROM Posts AS p
JOIN Users as u ON u.Id = p.OwnerUserId
WHERE p.Id = 13
GO
So, why does sp_executesql cause ad hoc plans to be stored as full plans in cache?
I don’t know. I came across this while blogging and thought it was worth its own post. If you know why or know more, feel free to send me a message or leave a comment!
The series is alive! It’s been a while since I last talked about memory grants. Don’t worry, I still care about memory grants.
First, our query
To StackOverflow2010! I’ll use the Users table, and we’ll query for the locations of users with a reputation of 500.
--First, an index
CREATE NONCLUSTERED INDEX ix_Users_Reputation
ON Users(Reputation)
INCLUDE (Location);
GO
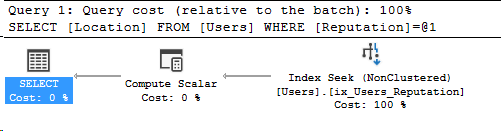
SELECT Location FROM Users
WHERE Reputation = 500;
--76 rows returned
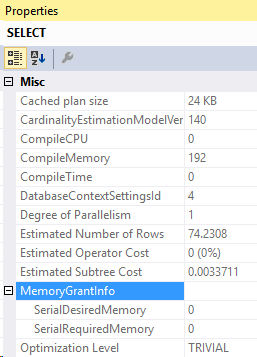
Here’s our execution plan and its properties.
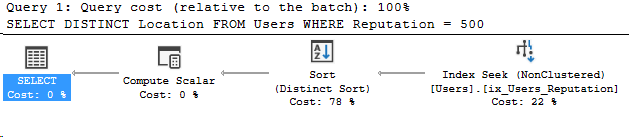
Alright, but now we need the distinct values!
SELECT DISTINCT Location FROM Users
WHERE Reputation = 500;
--46 rows returned
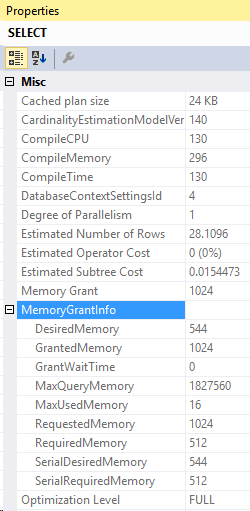
Ah, there’s our memory grant! But where did it come from? We’ll find the answer on the Sort.
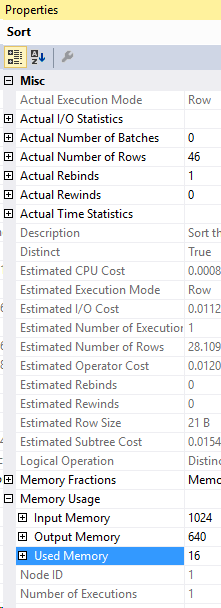
Taking a look at the Distinct Sort operator’s memory usage
Let’s take a closer look at that Distinct Sort. In the properties above, we see that the MaxUsedMemory is 16 KB.
There it is, this Sort used all of the 16 KB! It takes a bit of memory to get the DISTINCT values in this case because it used this sort operator to find the distinct values.
I hope this was interesting! Keep in mind that the size of the columns in your DISTINCT clause will influence the size of the memory grant. More details on that here.
Yesterday’s post talked about single use plans. The statements I’m using are also called ad hoc queries. The alternative to ad hoc would be to create an object like a stored procedure or preparing the statement with a command like sp_prepare or sp_executesql.
The object type will show as “ad hoc” if you’re looking inside sys.dm_exec_cached_plans , which I’ll do later in this post.
Let’s add that DMV to our DMV queries. As a reminder, here’s how I generated my queries:
SELECT TOP 200
N'EXEC(''SELECT Score FROM Posts AS p
JOIN Users as u ON u.Id = p.OwnerUserId
WHERE p.Id = ' + CAST(Id as nvarchar(200))  + ''')'
FROM Posts
ORDER BY Id
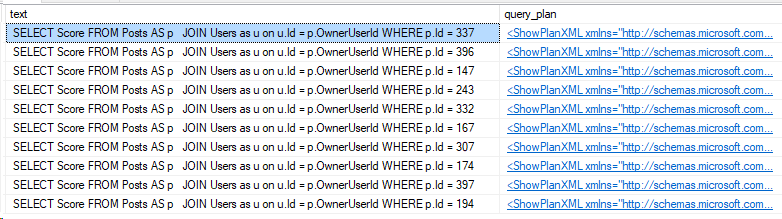
Okay, now looking in the plan cache:
SELECT TOP 10
cache.size_in_bytes,
cache.objtype,
stext.text,
splan.query_plan
FROM sys.dm_exec_query_stats as stat
CROSS APPLY sys.dm_exec_sql_text(stat.sql_handle) as stext
CROSS APPLY sys.dm_exec_query_plan(stat.plan_handle) as splan
JOIN sys.dm_exec_cached_plans as cache on cache.plan_handle = stat.plan_handle
WHERE stat.query_hash = 0x5F56B6B5EC1A6A6F
The setting, optimize for ad hoc
I can change the server level setting to On for optimize for ad hoc workloads. Let’s turn that on and try again.
/*
Don't run this in Prod. Always test settings thoroughly before applying
*/
EXEC sys.sp_configure N'optimize for ad hoc workloads', N'1'
GO
RECONFIGURE
GO
Okay, and now I’ll re-run the test workload from above, and then the plan cache query. Here’s the results:
The size in bytes per entry is massively reduced, and these were small execution plans to begin with. However, we lost the entire query plan. That’s not the only cost, but that can have consequences.
Moral of the post
In my opinion, there’s two big downsides to optimize for ad hoc.
First, we lose the query plan information for single use plans. That means that any queries that parse the plan cache (for example, sp_BlitzCache) will not be nearly as useful if your workload is heavily ad hoc. The query plan will be stored if the query runs twice, so this isn’t a total loss.
Second, compiling a plan isn’t free. Optimize for ad hoc stores a stub, but the plan was still compiled for the query when it runs.
Overall, my opinion is that if you’re worried about the memory space used by single use plans, you’ll benefit from the reduced size from optimize for ad hoc workloads.
There’s better solutions, like increasing execution plan re-use. That’s the topic of a future post! Stay tuned.
A single use plan is an entry in the SQL Server plan cache that was only used once. When a query generates many similar entries in the plan cache, that query is using extra CPU to generate plans and wasting memory space to store them.
I’m going to focus on finding all single use plans in my plan cache. Then, in a later post, I’ll discuss how to reduce the number of plans.
We can find these plans by counting the number of entries in sys dm_exec_query_stats per query hash, where the plan has an execution count of 1.
Here’s a sample script:
SELECT query_hash,
COUNT(*) as number_of_entries
FROM sys.dm_exec_query_stats
WHERE execution_count = 1
GROUP BY query_hash
HAVING COUNT(*) > 1
Setting up single use plans
So I want a lot of single use plans. I wrote this SQL in StackOverflow2010 to generate a bunch of queries that will each take up one spot in the plan cache.
SELECT TOP 200
N'EXEC(''SELECT Score FROM Posts AS p
JOIN Users as u ON u.Id = p.OwnerUserId
WHERE p.Id = ' + CAST(Id as nvarchar(200))  + ''')'
FROM Posts
ORDER BY Id
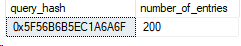
Running those queries on my test server, then running the script above it gives me this result:
So there’s 200 entries in the plan cache for this query. The plan cache can have up to 160,036 entries on 64-bit systems (source), so my test plan cache isn’t in any danger of running out of space.
Now let’s take a look at one of those queries. Take the query_hash from above, or one in your environment, and take a look:
SELECT TOP 10 stext.text,
splan.query_plan
FROM sys.dm_exec_query_stats as stat
CROSS APPLY sys.dm_exec_sql_text(stat.sql_handle) as stext
CROSS APPLY sys.dm_exec_query_plan(stat.plan_handle) as splan
WHERE stat.query_hash = 0x5F56B6B5EC1A6A6F
That’s just 10 of the 200 entries in my plan cache which are identical except for the value used in the WHERE clause.
In another post, I’ll tackle ways to handle these duplicates and reduce the number of single plans in cache. Stay tuned!
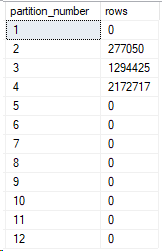
So, we’ve set up a table with table partitioning on the RIGHT for CreationDate. We defined 11 partitions, and in Partitioning 4, we saw 11 partitions. However, if we look in sys partitions, there’s actually 12.
SELECT
p.partition_number,
p.rows
FROM sys.partitions AS p
JOIN sys.tables AS t ON t.object_id = p.object_id
WHERE t.name = 'Posts_Partitioned'
AND p.index_id = 1;
What does this mystery partition contain?
Well, in Partition 2, I queried for the values in the 3rd partition. That was from the start to end of 2009. Let’s take a quick look at the partition function I created.
CREATE PARTITION FUNCTION Posts_Partition_Function (DATETIME)
    AS RANGE RIGHT FOR VALUES ('2008-01-01',
	'2009-01-01',
	'2010-01-01',
	'2011-01-01',
	'2012-01-01',
	'2013-01-01',
	'2014-01-01',
	'2015-01-01',
	'2016-01-01',
	'2017-01-01',
	'2018-01-01') ; --This is the 11th partition
GO
Let’s change some data and see what sys partitions shows for row count.
SELECT CreationDate
FROM Posts_Partitioned
WHERE Id IN (1,2);
GO
UPDATE Posts_Partitioned
SET CreationDate = '2001-04-01'
WHERE Id = 1;
UPDATE Posts_Partitioned
SET CreationDate = '2020-05-01'
WHERE Id = 2;
GO
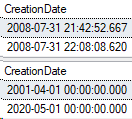
SELECT CreationDate
FROM Posts_Partitioned
WHERE Id IN (1,2);
GO
And here’s the results:
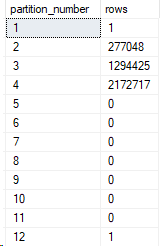
Great! Now back to the sys partitions query from above.
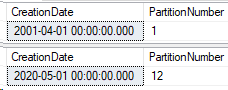
Now there’s data in both partition 1 and 12. Let’s query by partition function and see what data is inside those partitions.
SELECT CreationDate,
$PARTITION.Posts_Partition_Function(CreationDate) AS PartitionNumber
FROM Posts_Partitioned AS p
WHERE $PARTITION.Posts_Partition_Function(CreationDate) = 1;
GO

SELECT CreationDate,
$PARTITION.Posts_Partition_Function(CreationDate) AS PartitionNumber
FROM Posts_Partitioned AS p
WHERE $PARTITION.Posts_Partition_Function(CreationDate) = 12;
GO
What happened to the extra partition?
Well, data that falls outside the range of the last partition on the right side will go into the last partition for my range right partitioning function. This is handy in case bad data is input into your system or your partition maintenance jobs haven’t created enough partitions.
Hopefully this throws up warning signs about either the source of the bad data or the lack of extra partitions.
Stay tuned!
By continuing to use the site, you agree to the use of cookies. more information
The cookie settings on this website are set to "allow cookies" to give you the best browsing experience possible. If you continue to use this website without changing your cookie settings or you click "Accept" below then you are consenting to this.