Happy Friday! Today’s post will be light on the performance side and instead, I’m going to talk about how to take a look at your server’s partitioning.
First, partitioning in SQL Server Management Studio
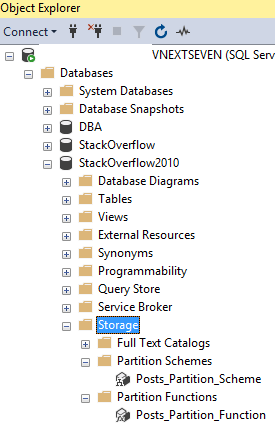
Object Explorer, that thing on the left side of the SSMS window, will show partition info. However, since partitioning is database-level, you’ll have to go to each database.
In your database, go to Storage, then to Partition Schemes or Partition Functions:
When I first started working on tables with partitioning, I kept expecting partitioning to be in “Programmability” with stored procedures and other programming functions. However, since partitioning is a storage feature, it makes sense to me that it’s stored here.
What about querying for all partition functions and schemes?
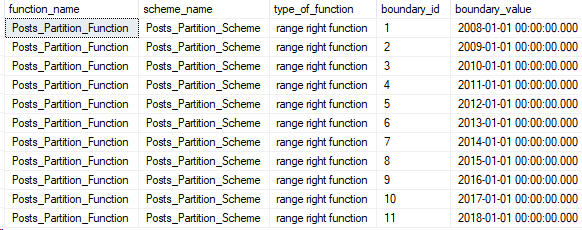
There’s several DMVs to find information on partitions. Since it’s Friday, I’ll just post my query and show you what the partition functions and schemes on my database look like:
USE StackOverflow2010
GO

SELECT
functions.name AS function_name,
schemes.name AS scheme_name,
CASE WHEN boundary_value_on_right = 1
	THEN 'range right function'
	ELSE 'range left function' END
AS type_of_function,
val.boundary_id,
val.value as boundary_value
FROM sys.partition_range_values AS val
JOIN sys.partition_functions AS functions
  ON val.function_id = functions.function_id
JOIN sys.partition_schemes AS schemes
  ON schemes.function_id = schemes.function_id
ORDER BY functions.name, boundary_id
Alright, that’s it! Keep in mind that partition functions and schemes are database-specific, so modify the query or run it in each of the databases you want to check. Stay tuned!
In Partitioning 2, I showed how to analyze which partitions were accessed by our Index Seek. However, we were searching the entire year’s partition for data. What if we filtered more specifically on the partitioning key?
Yesterday’s query: redux
Taking the same query, but this time let’s just search for a single month of CreationDates. In part 2, the query for the entire year read 130 pages of the Posts table, and now we just want September:
SET STATISTICS IO ON;
SELECT Score FROM Posts_Partitioned as p
JOIN Users as u on u.Id = p.LastEditorUserId
WHERE u.DisplayName = 'Community'
AND p.CreationDate >= '2009-09-01' and p.CreationDate < '2009-10-01'

/*
(3590 rows affected)
Table 'Posts_Partitioned'. Scan count 1, logical reads 130,
 physical reads 0, read-ahead reads 0, lob logical reads 0,
lob physical reads 0, lob read-ahead reads 0.

Table 'Users'. Scan count 1, logical reads 3, physical reads 0,
 read-ahead reads 0, lob logical reads 0, lob physical reads 0,
 lob read-ahead reads 0.

*/
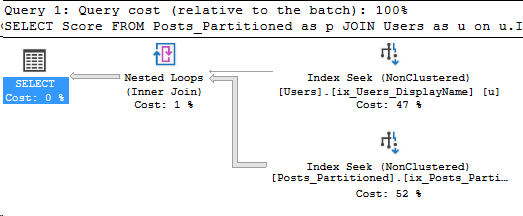
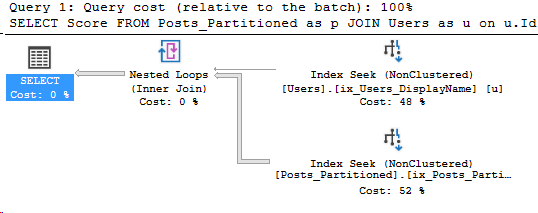
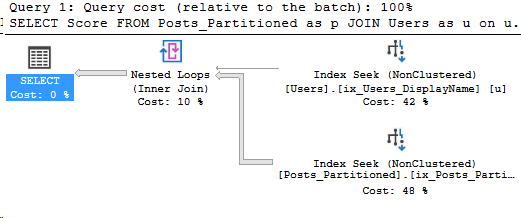
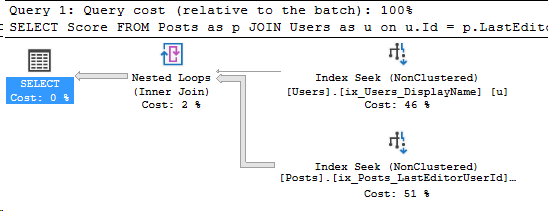
Here’s the execution plan for the new query as well:
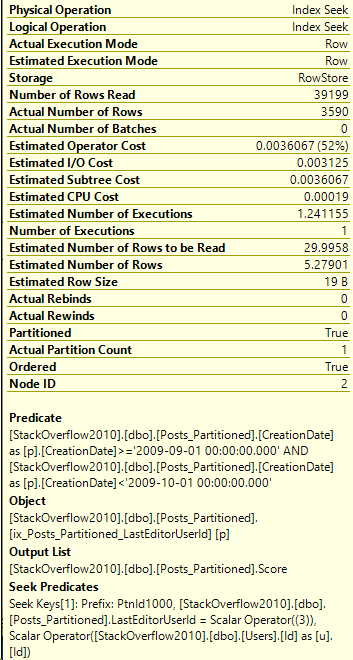
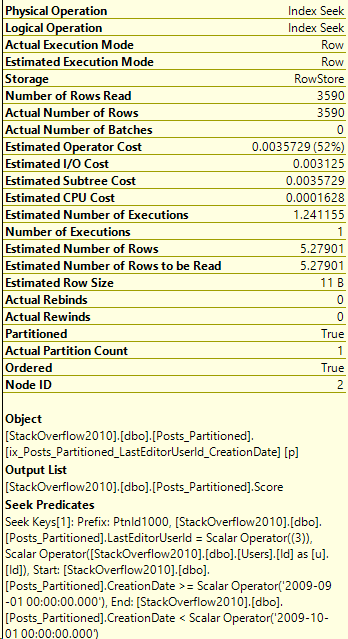
Details on the Posts_Partitioned Index Seek:
It’s a very similar execution plan, and the query looks fast. However, even though it returned less rows than the query in Partitioning 2, it still read the same amount of pages, 130.
Index design
At this point, we need to look at the index design. The index being used is defined as:
CREATE NONCLUSTERED INDEX ix_Posts_Partitioned_LastEditorUserId
ON Posts_Partitioned(LastEditorUserId)
INCLUDE (Score)
ON Posts_Partition_Scheme(CreationDate)
GO
So, let’s try changing the keys to see if we can get a better execution plan. First, let’s add CreationDate to the keys.
CREATE NONCLUSTERED INDEX ix_Posts_Partitioned_LastEditorUserId_CreationDate
ON Posts_Partitioned(LastEditorUserId,CreationDate)
INCLUDE (Score)
ON Posts_Partition_Scheme(CreationDate)
GO
And re-running our query:
SET STATISTICS IO ON;
SELECT Score FROM Posts_Partitioned as p
JOIN Users as u on u.Id = p.LastEditorUserId
WHERE u.DisplayName = 'Community'
AND p.CreationDate >= '2009-09-01' and p.CreationDate < '2009-10-01'

/*
(3590 rows affected)
Table 'Posts_Partitioned'. Scan count 1, logical reads 16,
 physical reads 0, read-ahead reads 0, lob logical reads 0,
 lob physical reads 0, lob read-ahead reads 0.

Table 'Users'. Scan count 1, logical reads 3, physical reads 0,
 read-ahead reads 0, lob logical reads 0, lob physical reads 0,
 lob read-ahead reads 0.
*/
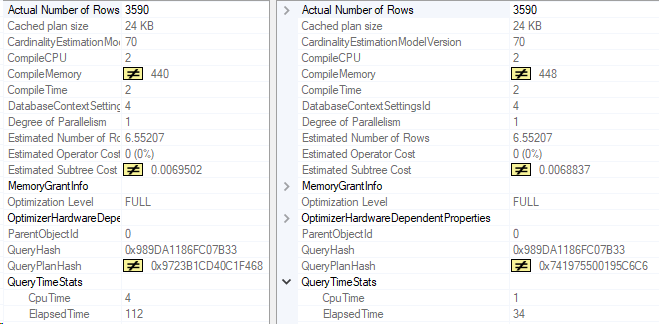
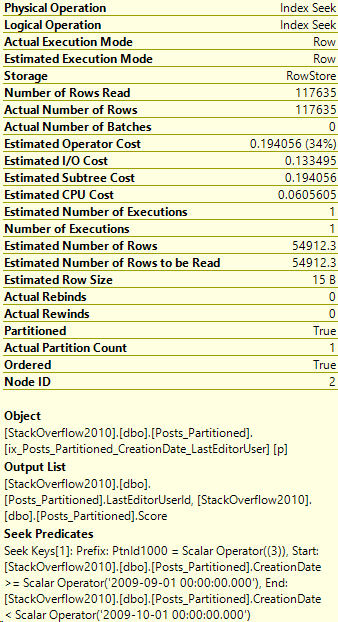
That’s a lot better! And here’s the index seek’s information:
Click image for better quality
Even better. Let’s compare these two execution plans. The left side is with the original index, the right side is after, with the CreationDate key added.
What’s the moral of this post?
The point I want to make is that post-partitioning, you may have to re-think some of your existing indexes. Even if you add the partitioning key to all your queries, that can change your workload enough that you’ll want to examine your indexes.
Stay tuned!
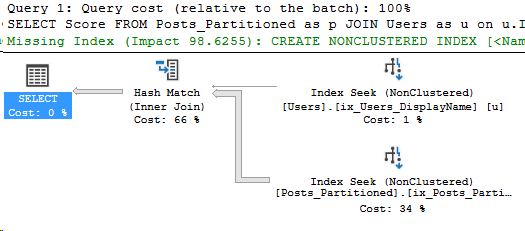
P.S. What if we put CreationDate as the first key in the index?
I’ll drop the index used in this example, and create an index with CreationDate as the first key column.
DROP INDEX ix_Posts_Partitioned_LastEditorUserId_CreationDate
ON Posts_Partitioned
GO
DROP INDEX ix_Posts_Partitioned_LastEditorUserId
ON Posts_Partitioned
GO

CREATE NONCLUSTERED INDEX ix_Posts_Partitioned_CreationDate_LastEditorUser
ON Posts_Partitioned(CreationDate,LastEditorUserId)
INCLUDE (Score)
ON Posts_Partition_Scheme(CreationDate)
GO
And now we re-run the query from above. Let’s take a look at the stats and the execution plan:
In Partitioning 1, my query searched through all 1-12 partitions. Let’s see if we can reduce that number.
Adding the partitioning key to your query
Since I created the index in part 1 on the Posts_Partition_Scheme, the index was split up among the partitions. What if I only want to search data, let’s say in 2009? Well, in that case, we should add it to our query!
In part 1, I defined the table with a RIGHT partitioning function on the column CreationDate, with one partition per year.
SET STATISTICS IO ON;
SELECT Score FROM Posts_Partitioned as p
JOIN Users as u on u.Id = p.LastEditorUserId
WHERE u.DisplayName = 'Community'
AND p.CreationDate >= '2009-01-01' and p.CreationDate < '2010-01-01'

/*
(39199 rows affected)
Table 'Posts_Partitioned'. Scan count 1, logical reads 130,
physical reads 0, read-ahead reads 0,
lob logical reads 0, lob physical reads 0,
lob read-ahead reads 0.

Table 'Users'. Scan count 1, logical reads 3,
 physical reads 0, read-ahead reads 0,
lob logical reads 0, lob physical reads 0,
lob read-ahead reads 0.
*/
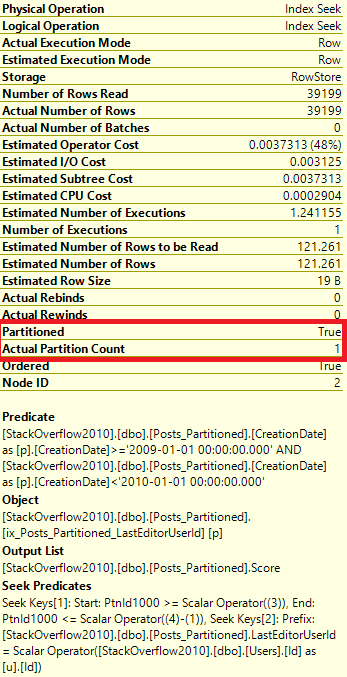
The total is 130 logical pages read, not bad! Let’s take a look at the execution plan.
And I’ll focus on the Index Seek for Posts_Partitioned:
Click the image for better quality
Hmm, while this execution plan looks good, since there’s a non-Seek predicate on CreationDate, it might also be worthwhile to add the partitioning key to my index. Stay tuned for more posts in this series where I’ll talk about improving this index!
For now, let’s focus on the Actual Partition Count value. In the example in Part 1, the query used all 12 partitions. Now the query only accessed one partition.
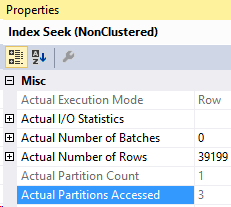
Which partition was accessed?
Well, to find which partition was accessed, let’s look at the Properties of the Index Seek from above.
Ah, so it accessed partition #3! Now, since we created this partition function recently, we know that’s 2009. But what if we didn’t know that?
Finding min and max values in a partition
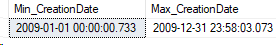
Here’s a query I wrote for Posts_Partitioned to get the min and max values for my partition function, based on $PARTITION.
SELECT
MIN(CreationDate) as Min_CreationDate,
MAX(CreationDate) as Max_CreationDate
FROM Posts_Partitioned as p
WHERE $PARTITION.Posts_Partition_Function(CreationDate) = 3
GO
Query results:
As we might expect, both values fall within 2009.
Okay, that’s it for this post! I wanted to show how you could achieve and measure partition elimination in a specific query. I want to fix that index from earlier and talk more about partitions later.
This month’s T-SQL Tuesday is hosted by Andy Leonard at andyleonard.blog . Andy asks us, what is your “Why?”
So what is my Why? Well, I want to talk about a few things I do.
My current job and why
Currently I work primarily as a performance focused DBA. I originally took this job because I found performance really intriguing. I was curious to learn more and be able to devote more of my time to improving database performance
My Why, or the reason I keep doing this job, is a number of factors. First, I work with a great team of intelligent and kind DBAs, who teach me things everyday.
Second, I really enjoy improving the database so that users have a better experience. When I get a chance to hear that I helped someone, it makes my job so satisfying.
Third, the challenge. It seems like there’s always something new to learn or a new problem to solve. For example, last week we were contacted about a specific function running slowly. I discovered it was a new issue to me. The data and statistics had changed in specific index, causing the query to pick a different, sub-optimal index every time it ran.
The reason I started blogging
Some of my friends have asked me why I’m blogging so much. Back in December, I made a commitment to myself to blog about something I found interesting every day.
It all started on seths.blog . Seth Godin is a marketer, and he writes a daily blog. I couldn’t find the post that inspired me, but one of the posts said something to the effect of ‘I’ve never met someone who blogged daily for 100 days and regretted it.’
When I read that sentence, I knew I had to commit to trying it. And here we are! I crossed 60 blog posts this week, so I still have many to go before I reach 100.
Wrap-up
Thanks for the invite, Andy! I enjoyed taking the time to think about all the Whys in my life.
Here’s my take on partitioning. I’ll be focusing on getting queries to perform on partitioned tables, and not on partition maintenance, which can be its own headache. This is the first part in a series I’m planning to write, so this post may not answer all the questions.
Partitioning disclaimer
I feel like it’s necessary to add a disclaimer: Partitioning is not designed as a performance feature, its strengths are in moving large amounts of data in a single command. Truncating an entire partition is also an easy way to delete stale data without using a lot of space in the transaction log.
Setting up a partitioned table
CREATE PARTITION FUNCTION Posts_Partition_Function (DATETIME)
    AS RANGE RIGHT FOR VALUES ('2008-01-01',
	'2009-01-01',
	'2010-01-01',
	'2011-01-01',
	'2012-01-01',
	'2013-01-01',
	'2014-01-01',
	'2015-01-01',
	'2016-01-01',
	'2017-01-01',
	'2018-01-01') ;
GO
CREATE PARTITION SCHEME Posts_Partition_Scheme
    AS PARTITION Posts_Partition_Function  ALL
    TO ([PRIMARY]) ;
GO
And creating a Posts_Partitioned table, in StackOverflow2010, to demo the scripts:
USE [StackOverflow2010]
GO
SET ANSI_NULLS ON
GO
SET QUOTED_IDENTIFIER ON
GO
IF NOT EXISTS (SELECT * FROM sys.objects WHERE object_id = OBJECT_ID(N'[dbo].[Posts_Partitioned]') AND type in (N'U'))
BEGIN
CREATE TABLE [dbo].[Posts_Partitioned](
	[Id] [int] IDENTITY(1,1) NOT NULL,
	[AcceptedAnswerId] [int] NULL,
	[AnswerCount] [int] NULL,
	[Body] [nvarchar](max) NOT NULL,
	[ClosedDate] [datetime] NULL,
	[CommentCount] [int] NULL,
	[CommunityOwnedDate] [datetime] NULL,
	[CreationDate] [datetime] NOT NULL,
	[FavoriteCount] [int] NULL,
	[LastActivityDate] [datetime] NOT NULL,
	[LastEditDate] [datetime] NULL,
	[LastEditorDisplayName] [nvarchar](40) NULL,
	[LastEditorUserId] [int] NULL,
	[OwnerUserId] [int] NULL,
	[ParentId] [int] NULL,
	[PostTypeId] [int] NOT NULL,
	[Score] [int] NOT NULL,
	[Tags] [nvarchar](150) NULL,
	[Title] [nvarchar](250) NULL,
	[ViewCount] [int] NOT NULL,
 CONSTRAINT [PK_Posts__Id_CreationDate] PRIMARY KEY CLUSTERED
(
	[Id], [CreationDate]
)ON [Posts_Partition_Scheme](CreationDate) )
END
GO
Loading some data into Posts_Partitioned
I used the SSIS Import/Export Data Wizard and specified all the columns except the Id column. There’s about 3.7 million rows loaded.
Creating some indexes and comparing performance before and after
Query performance on partitioned tables can be confusing. Yes, queries can run faster on partitioned tables IF they can use partition elimination. That means that the query contained the partitioning column in one of the predicates, like the WHERE clause or the JOIN. Then, the SQL Server optimizer is able to skip those partitions when running the query.
What I’m focusing on is whether a query performs better or worse after partitioning, whether the query is capable of partition elimination, and if it achieved that partition elimination.
First, we’ll create indexes, with the index on Posts_Partitioned aligned to the partition.
CREATE NONCLUSTERED INDEX ix_Posts_LastEditorUserId
ON Posts(LastEditorUserId)
INCLUDE (Score)
GO

CREATE NONCLUSTERED INDEX ix_Users_DisplayName
ON Users(DisplayName)
GO

CREATE NONCLUSTERED INDEX ix_Posts_Partitioned_LastEditorUserId
ON Posts_Partitioned(LastEditorUserId)
INCLUDE (Score)
ON Posts_Partition_Scheme(CreationDate)
GO
Great! Let’s run a query on these tables with our brand new indexes.
SET STATISTICS IO ON;
SELECT Score FROM Posts as p
JOIN Users as u on u.Id = p.LastEditorUserId
WHERE u.DisplayName = 'Community'

--The Community user in StackOverflow is an internal user,
--so it has a lot of posts!

/*
(118119 rows affected)
Table 'Posts'. Scan count 1, logical reads 267,
 physical reads 0, read-ahead reads 0,
 lob logical reads 0, lob physical reads 0,
 lob read-ahead reads 0.

Table 'Users'. Scan count 1, logical reads 3,
 physical reads 0, read-ahead reads 0,
 lob logical reads 0, lob physical reads 0,
 lob read-ahead reads 0.
*/
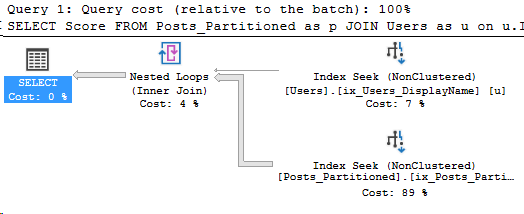
What about the execution plan?
Looks pretty good to me.
The same query, same indexes on Posts with partition aligned indexes
Uh-oh. This looks a little worse. Just to be sure, let’s look at the execution plan:
So what happened?
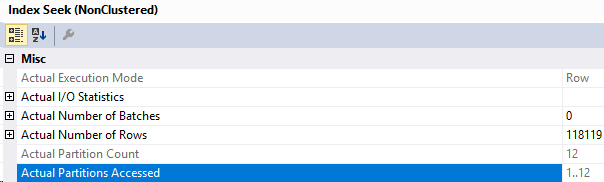
The first giveaway is that the query on Posts_Partitioned has a “Scan count” of 12. There’s more answers here though, let’s take a look at the Index Seek.
Here’s the properties of the Index Seek on Posts_Partitioned:
So this Index Seek had to access each partition to check if it had data for our Community user. That increased the amount of work done.
Summary of this example
This is an example of when a query didn’t achieve partition elimination, and therefore it did more work on the partitioned table. I hope to write some other posts on whether this issue could be fixed in the query, and other query patterns that can cause confusion when working with partitioning.
I apologize in advance if I mess up the terminology.
I’ve worked with a moderate read workload on a readable replica and I wanted to share some of the things I’ve seen.
First, how in sync is your replica?
To make an Availability Group replica readable, you have to set to asynchronous commit. This means that you might be reading old data. I recommend creating a tracking table. I think a similar technique is sometimes used in replication.
Run an Agent job on the primary replica that inserts a date every 5-10 seconds, and then make sure it stays up to date. While you can achieve a similar effect with PerfMon counters and monitoring scripts, you want a table like this so that your applications can see how up-to-date their data is. Here’s a simple example.
CREATE TABLE LatestDate (LogDate datetime2)
GO
CREATE CLUSTERED INDEX cx_LogDate on LatestDate(LogDate)
GO

--Run the below script as frequently as your environment demands.
INSERT INTO LatestDate (LogDate)
SELECT GETDATE()
What about query performance?
If you heavily use readable secondaries, you need to monitor the performance over there. Not just the CPU, memory and plan cache, but also the index usage and missing index DMVs. Here’s a script you can split into two parts to capture the missing index requests, I don’t have a script for index usage on my blog yet.
Isolation level on your replica (+ TempDB usage increase)
There’s also a couple more caveats here. First, the isolation level changes on readable replicas.
” All queries that run against the secondary databases are automatically mapped to snapshot isolation transaction level, even when other transaction isolation levels are explicitly set. ” Source
That means all the NOLOCK hints don’t do anything. That doesn’t mean there will be blocking, the snapshot isolation level should prevent that. But it does mean more TempDB usage in terms of the version store. Check out the dm_tran_version_store_usage .
One more thing
There’s probably a lot more that can be written on this subject. I want to conclude by saying I still think that readable replicas are very useful, and provide a list of a few closed bugs from recent SQL Server updates:
I think Dynamic Data Masking is pretty cool. The idea is basically to provide a mask for certain users when they might see protected data. The documentation on this feature is actually pretty deep, it’s worth a look.
I just want to show you how you can see the masking in an execution plan. Let’s mask some data in StackOverflow2010! (Also, there’s an interesting side note at the end)
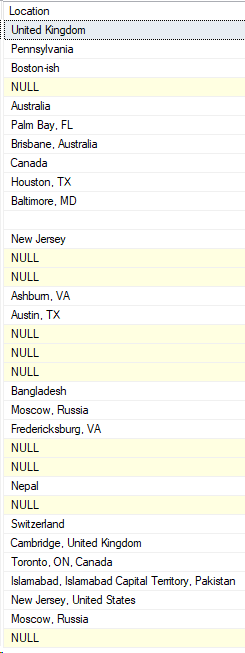
First, what the administrator sees
SELECT Location
FROM Users as u
WHERE u.Reputation = 1001
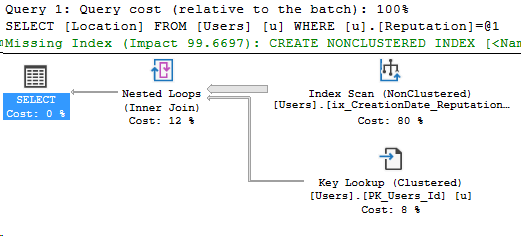
And of course, the administrator’s execution plan!
Applying the data mask
ALTER TABLE Users
ALTER COLUMN Location
ADD MASKED WITH (FUNCTION = 'default()')
That’s pretty straightforward. As far as I can tell, you can’t define a custom mask. I was going to leave a joke as the mask but oh well!
What it looks like to a user (+the data mask execution plan)
Luckily there’s a test script on the information page for Dynamic Data Masking. That makes this part easier. Here’s my slight variation of it.
CREATE USER User1 WITHOUT LOGIN;
GRANT SELECT ON Users TO User1;
GRANT SHOWPLAN  TO User1;
EXECUTE AS USER = 'User1';

SELECT Location
FROM Users as u
WHERE u.Reputation = 1001;
REVERT;
This was actually trickier than I expected. Let’s take a look at the results.
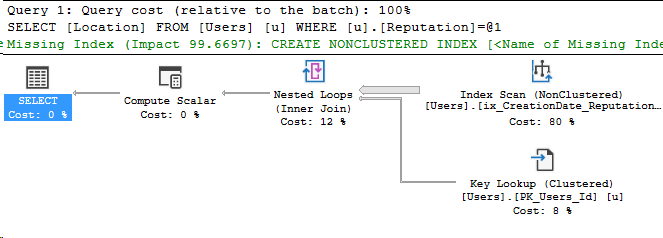
And the main event, the new execution plan:
Reviewing the data mask execution plan
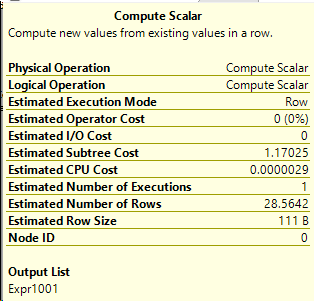
The only difference is that Compute Scalar operator. Let’s take a look at it.
Okay, cool it’s Expr1001. What is that in words we can understand?
[Expr1001] = Scalar Operator(
DataMask([StackOverflow2010].[dbo].[Users].[Location]
as [u].[Location],0x07000000,(1),(0),(0),(0)))
Aha. That’s pretty cool, since this scalar function isn’t applied until the data is being retrieved, that saves it from doing extra work. This also explains why there’s warnings on the documentation about ad hoc queries.
If someone has ad hoc query access and you’re using Dynamic Data Masking, the predicates are still literally applied.
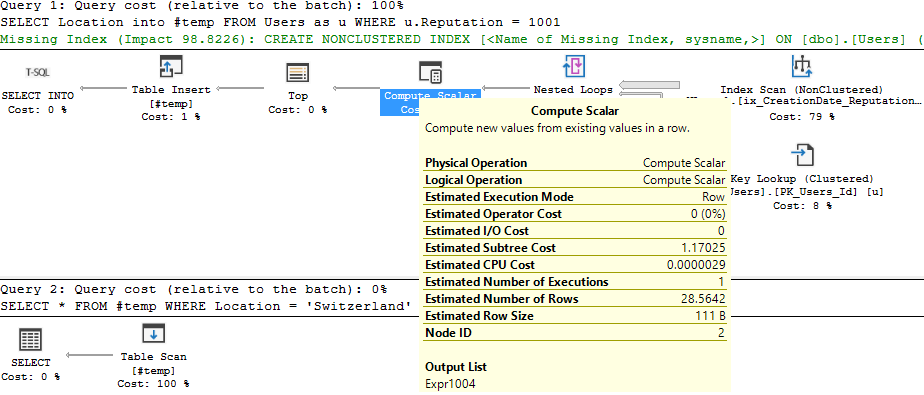
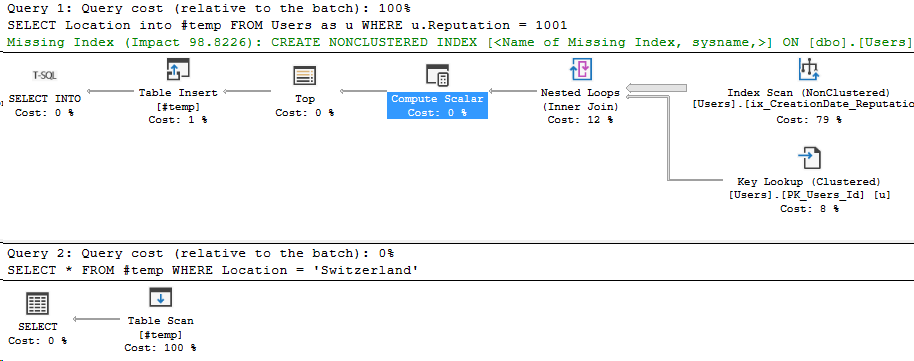
Bonus chapter: What about intermediate results storage, like temp tables?
Well, this should be interesting. Let’s load the results of the previous query into a temp table and then filter.
EXECUTE AS USER = 'User1';

SELECT Location
into #temp
FROM Users as u
WHERE u.Reputation = 1001

SELECT * FROM #temp
WHERE Location = 'Switzerland'

DROP TABLE #temp;
REVERT;
Uh oh. I didn’t get any rows back:
Here’s the execution plan, highlighting where the filter was applied:
What if I run the same query as my normal admin account?
I get the same execution plan actually! Even including the Compute Scalar. But this time, my query returns one row.
Well, what do you think? To me, it looks like there could be some oddities when using temp tables with data masking.
Thanks for reading this abnormally long post. I might like execution plans a bit. Stay tuned!
At first, this statement might sound a bit confusing. Usually, we expect wait statistics to show us what a query is waiting on, whether it’s waiting on memory, loading pages from disk, or any of the other numerous wait types.
Once you start collecting wait statistics, you’ll have a lot of data to sort through. You might find waits like CX_PACKET, CX_CONSUMER, and PAGEIOLATCH. Surprisingly, these could mean that your databases aren’t well indexed.
Let’s take a look at an example in StackOverflow2010
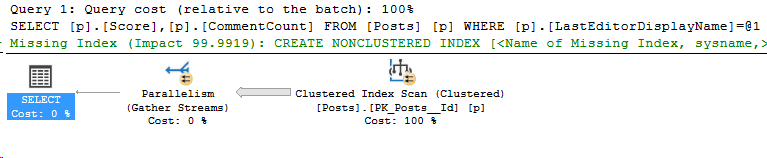
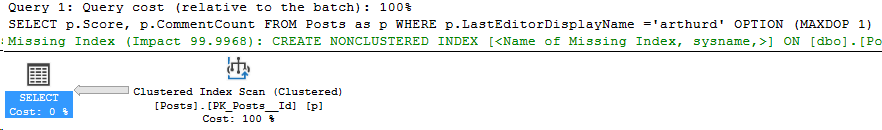
For the sake of this post, pretend that this query is mission critical, and we need to diagnose why it’s running slow and fix it by any means possible.
SELECT p.Score, p.CommentCount
FROM Posts as p
WHERE p.LastEditorDisplayName ='arthurd'
--0 rows returned, took 38 seconds
Here’s the actual execution plan.
For now, let’s ignore the missing index request. Missing indexes are unreliable. Let’s start by using sp_WhoIsActive while the query runs, and see what it says.
Click the image for details.
Hmm, it shows the wait type of CX_CONSUMER. This is a parallelism wait, let’s try the query again with OPTION (MAXDOP 1).
Trying the query with no parallelism
SELECT p.Score, p.CommentCount
FROM Posts as p
WHERE p.LastEditorDisplayName ='arthurd'
OPTION (MAXDOP 1)
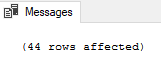
--0 rows returned, 1 minute 30 seconds duration
Here’s another capture of sp_WhoIsActive, this time with only one core so there’s no parallelism.
Click the image for details.
Oh now we have another wait. This time, it’s PAGEIOLATCH_SH. That’s an IO wait, SQL Server is having to retrieve the data pages from disk. But wait, we haven’t even considered that we could index this problem.
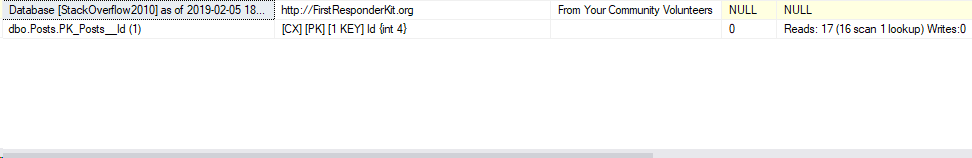
Finding a solution without calling the SAN admin
Check the indexes on the table with your favorite script. I’ll pick sp_BlitzIndex
So there’s no nonclustered indexes on this table. The top index, PK_Posts_Id is the clustered index and it’s being scanned each time. Let’s create a covering index for our mission critical query.
CREATE NONCLUSTERED INDEX ix_LastEditorDisplayName
ON Posts(LastEditorDisplayName)
INCLUDE (Score, CommentCount)
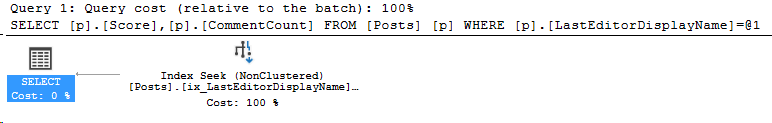
And now we re-run our query, no MAXDOP hint.
set statistics time on;
SELECT p.Score, p.CommentCount
FROM Posts as p
WHERE p.LastEditorDisplayName ='arthurd'
--7 milliseconds
Now the query runs quickly! No wait statistics to be found.
Moral of the post
I don’t want people who read this post to think that I’m a proponent of creating indexes for every single slow query. I also don’t want to leave the impression that wait statistics always mean there’s issues with queries.
However, in some cases, the wait statistics can be a symptom of broader issues with poorly written queries, lack of indexing strategy, and other performance problems. I still recommend starting with wait statistics, then work your way through your environment to see if the database is designed properly and tuned.
When I first saw this command, I was like, awesome! This makes deploy scripts or scripts with temp tables easier.
Now queries with temp tables are super easy to write. Just write, for example:
DROP TABLE IF EXISTS #test_table

SELECT *
into #test_table
FROM sys.dm_exec_requests
Boom! The query is instantly re-runnable without a DROP TABLE command at the very end of the statement. Here’s the results on my test machine, and I can run this query over and over without it failing.
But wait, there’s more. What if you wanted to create a nonclustered index with the same idea? (Keep in mind that dropping an index can be a blocking operation)
DROP INDEX IF EXISTS ix_test1 ON Posts

CREATE NONCLUSTERED INDEX ix_test1 ON Posts(OwnerUserId)
Again, you get the same result every time you run:
This is possibly the most useful addition for code deploys. Instead of having to check if the object exists in your code deployer logic, just use create or alter like so:
CREATE OR ALTER PROCEDURE sp_Test as
BEGIN
SELECT 1
END
GO
Every time you run this code, it completes successfully.
I’m using create or alter often, it just makes life easier. Stay tuned!
A lot of us turn to execution plans when we see a slow running query, and it’s not uncommon to see missing index requests. If you’re a developer who comes across a missing index request in their execution plan, keep in mind that there can be more than one request in a single plan!
Besides that fact, your SQL Server is keeping track of the missing indexes that your queries request. They’re all stored in dm_db_missing_index_details, and a few other views.
The limitations of dm_db_missing_index_details
Here’s the biggest limitation: This DMV is reset every time your server reboots. It’s also database-specific. Oof. Well, what can we do about that?
I’ll provide a sample script of a way to collect this information at the end of this post. Let’s walk through a query that requests a missing index, then log that.
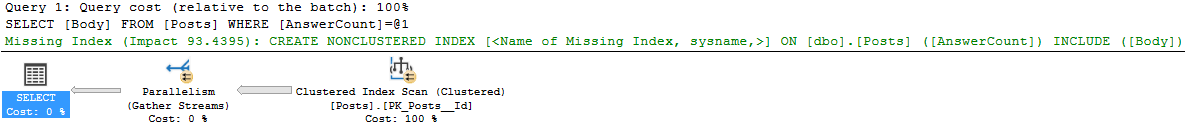
SELECT Body FROM Posts
WHERE AnswerCount = 10
93% impact
Great! Now we need a table. Please feel free to make your own, here’s one I created for this example.
Create table and script to store missing index details
And here’s our query to insert into that table. This query could be wrapped in a stored procedure if logging locally, or converted into two separate parts if you want to collect from a remote server.
INSERT INTO DBA.dbo.MissingIndexLog
(  table_name,
  database_name,
  equality_columns,
  inequality_columns,
  included_columns,
  user_seeks,
  user_scans,
  avg_total_user_cost,
  avg_user_impact,
  server_name)
SELECT statement,
   DB_NAME(detail.database_id),
   equality_columns,
   inequality_columns,
   included_columns,
   stat.user_seeks,
   stat.user_scans,
   stat.avg_total_user_cost,
   stat.avg_user_impact,
   @@SERVERNAME
FROM sys.dm_db_missing_index_details as detail
  JOIN sys.dm_db_missing_index_groups as groups
    ON groups.index_handle = detail.index_handle
  JOIN sys.dm_db_missing_index_group_stats as stat
    ON stat.group_handle = groups.index_group_handle
--1 row affected
Let’s take a look at the result set.
Click image to magnify
Excellent! So in the table name, we get the database name. We can also see the average user impact was logged directly from the execution plan I showed earlier.
I hope this was useful! I recommend at least logging this information between server reboots. Feel free to capture more frequently.
Stay tuned!
By continuing to use the site, you agree to the use of cookies. more information
The cookie settings on this website are set to "allow cookies" to give you the best browsing experience possible. If you continue to use this website without changing your cookie settings or you click "Accept" below then you are consenting to this.